The heart is a wondrous structure which manages to continuously pump an average of 5 liters of blood per minute throughout the body, through a series of complex electrical and biochemical interactions. An electrical impulse generated in the sinoatrial node quickly disperses through the heart to generate a synchronized series of contractions, first in the atria and then in the ventricles. The left ventricle serves as the main pumping chamber of the heart forcing blood through the aortic valve into the high resistance systemic circulation, providing oxygen to the entire body. When left ventricular failure occurs, initially the bodys demands may be met but at the cost of abnormally high "filling pressures" within the left ventricle. Ultimately left heart failure may result in an inability of the left ventricle to pump blood forward to meet the bodys demands, leading to organ hypoperfusion, acidosis, shock and death.
For the sake of this course, we will have to consider
an idealized heart which functions as a simple muscular pump, which can
be exposed to various filling and emptying conditions. Each single beat
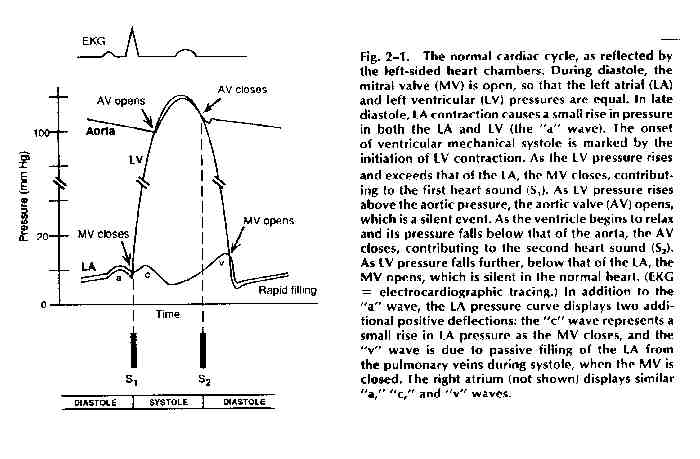
of the heart can be described as one "cardiac cycle." A diagram of the
cardiac cycle, taken from page 19 of the textbook is reproduced here.
The cardiac cycle -- diastole and systole:
The cardiac cycle consists of two major components. Diastole is the period of left ventricular relaxation and filling, beginning with the closure of the aortic valve and ending with closure of the mitral valve. The majority of ventricular filling occurs during the first phase of diastole, the rapid ventricular filling phase. The remainder of ventricular filling occurs at the very end of diastole at which time there is atrial contraction followed immediately by closure of the mitral valve. Approximately 10 - 25% of left ventricular filling occurs during this "atrial kick" phase of diastole, during which the left ventricular end-diastolic pressure rises slightly.
A major influence on how well the left ventricle fills is the "compliance" of the left ventricle. Compliance is defined as the inverse of stiffness (where stiffness = D P / D V and where compliance = D V / D P) i.e., a more compliant left ventricle will allow for a larger change in volume for any given change in pressure. Left ventricular compliance is described using left ventricular filling curves which plot change in volume versus change in pressure. The slope of the curve reflects the myocardial compliance at any given point during left ventricular filling. Note that at low filling pressures, the left ventricular compliance curve is almost linear but that at higher volume and pressures it begins to curve upward more steeply.
Left ventricular systole occurs when the mitral valve closes and the left ventricle begins to contract, first through a brief period of "isovolumic contraction", immediately followed by opening of the aortic valve and the main portion of systole: left ventricular ejection. This in turn is followed by closure of the aortic valve.
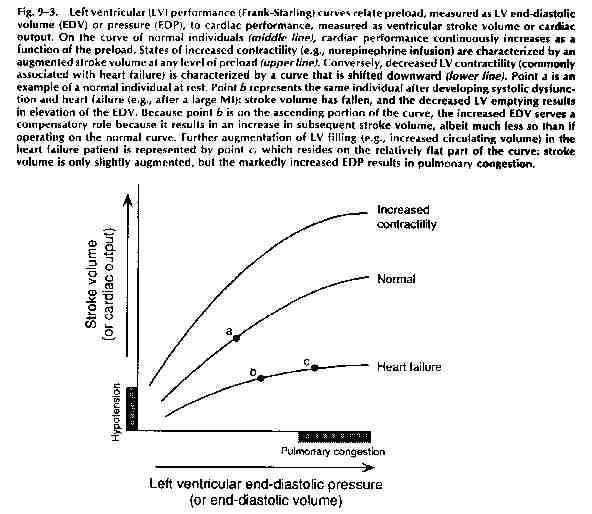
Systole can be considered the active phase of the cardiac cycle where myocardial contractility becomes the key to left ventricular performance. Left ventricular systolic performance can be graphed on a "Frank-Starling performance curve" which plots left ventricular performance, i.e. cardiac output, as related to left ventricular end-diastolic pressure (which in turn relates to the degree of filling which occurred during diastole.) A sample curve is included below, on page
Cardiac Output: The cardiac output, simply defined, is the net volume ejected by the left ventricle per minute, and is equal to the stroke volume times the heart rate, expressed in units of liters per minute. In turn, the stroke volume (the volume of blood ejected by the heart with each beat) is determined by a number of factors, as diagrammed below:
Each of these terms is defined in the table below, as taken from the textbook, page 150:
Table 9-1. Terms Related to Cardiac Performance
Term Definition
Preload: The ventricular wall tension at the end of diastole. In clinical terms, it is the stretch on the ventricular fibers just prior to contraction, often approximated by the end-diastolic volume or end-diastolic pressure.
Afterload: The ventricular wall tension during contraction; the resistance that must be overcome in order for the ventricle to eject its contents. It is often approximated by the systolic ventricular (or arterial) pressure.
lnotropic State
(Contractility): A measurement
of the magnitude of contractile force at a given resting fiber length.
Stroke Volume: Volume of blood ejected from the ventricle in systole (= end-diastolic volume - end-systolic volume).
Ejection Fraction: The fraction of end-diastolic volume ejected from the ventricle per beat (= stroke volume / end-diastolic volume). Normal range = 55-75%
Cardiac Output: Volume of blood ejected from the ventricle per minute (= stroke volume X heart rate).
Loading Conditions -- Preload and Afterload: The terms "preload" and "afterload" are defined as the wall tension or wall stress during diastole and during systole, respectively. What does this mean in real terms? Well...........wall tension is defined as follows:
Wall tension = P x r
2h where r = LV radius
and h = wall thickness
During diastole: the major variable which is changing is the radius of the ventricle as it fills with blood, since the radius changes in proportion to the cube root of the volume, while the pressure changes little (see the cardiac cycle diagram) and the thickness changes little. It is for this reason that, clinically, we relate preload to the degree of volume which is loading the ventricle.
During systole: the major variable which is changing is the pressure (again, look at the cardiac cycle diagram), while, relatively, the radius and the thickness of the ventricle are not changing as much. We therefore relate afterload to the pressure which the ventricle is pumping against, i.e. aortic pressure or the "blood pressure".
Note that any factor which lowers blood pressure will therefore lower afterload. Likewise, any factor that lowers left ventricular end-diastolic volume will lower preload. Also, note that a compensatory increase in left ventricular wall thickness (i.e. left ventricular concentric hypertrophy) will decrease wall tension both in systole and diastole, and will therefore decrease both preload and afterload.
Contractility: During systole, often thought of as the active phase of the cardiac cycle, the left ventricle contracts forcefully, ejecting approximately two-thirds of its contents with each beat. The force of contraction is determined by the "contractility" of the ventricle, which, in turn, varies with the length of the individual sarcomere. In general, the farther each individual sarcomere is stretched, the greater the force of contraction. There is a limit, of course, to the length which each sarcomere can be stretched, and there is a point beyond which no further incremental force will be generated.
To demonstrate the relationship between loading conditions and LV performance, a curve called a Frank-Starling performance curve can be created by plotting left ventricular end-diastolic volume (or pressure) -- i.e. preload -- versus left ventricular cardiac output -- LV performance. The position and slope of the curve reflect the contractile state of the individual ventricle at the point in time that the curve is drawn. Factors that augment the contractile state of the ventricle (i.e. adrenergic agents, positive inotropes, etc.) tend to shift the Starling curve of a ventricle upwards and to the left (see figure below).
Measurement of Cardiac Output: Well, the above curves sure look nice, but how on Earth do we obtain the values to create such a curve -- i.e. how do we measure LVEDP and how do we measure the cardiac output.
So far, the most reliable way to do both is to place a balloon-tipped flexible tube called a Swan-Ganz catheter into a vein, and thread it through the right side of the heart to the pulmonary artery. There, inflation of the balloon allows us to measure the "pulmonary capillary wedge pressure" which, in turn, reflects the left atrial pressure. Since the mitral valve is open during diastole, the left atrial pressure equals the left ventricular diastolic pressure (barring any mitral valve stenosis). We have therefore indirectly been able to measure the LVEDP.
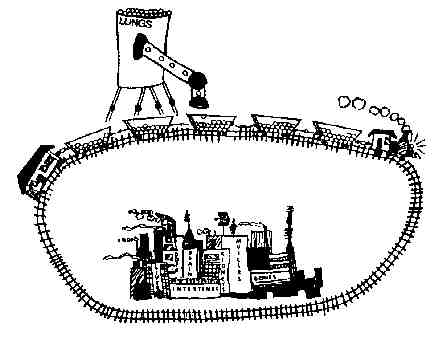
Using the same catheter, we can estimate the cardiac output using either the Fick Principle or the "thermodilution method". In brief, the Fick principle states that the cardiac output is proportional to the patients oxygen consumption divided by the "A-V O2 difference":
Cardiac output proportional to: O2
consumption
A-V O2 difference
where the A-V O2 difference is the difference in the bloods oxygen
saturation between where it exits the heart and where it enters the heart.
In essence, the slower the blood travels through the body, the more
oxygen is extracted by the bodys tissues, the greater the A-V O2
difference, and the lower the cardiac output. This is illustrated
schematically below by none other than the daughter of Eugene Braunwald
M.D., chairman of the Dept of Medicine at the Brigham and Womens Hospital.
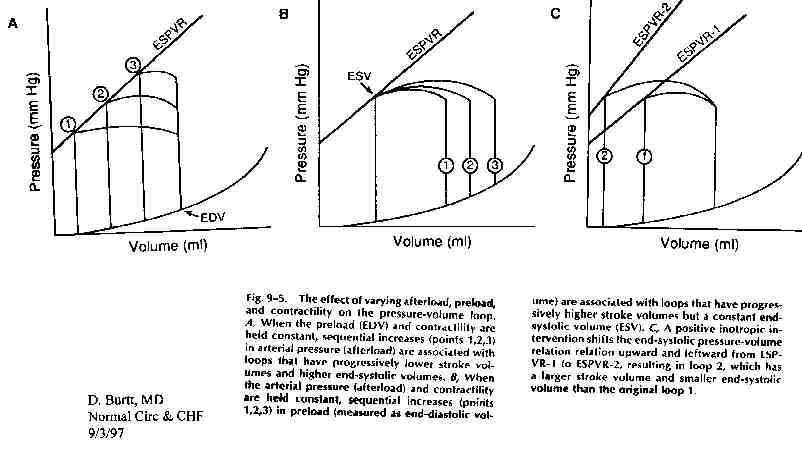
Pressure - Volume Loops: A pressure - volume
loop graphically displays the relationship between LV pressure and LV volume
in a single cardiac cycle. These curves can be used to graphically depict
the effects of various therapies on LVEDP and stroke volume. The figure
below illustrate how changing a single parameter (i.e. afterload, preload,
or contractility) can change the stroke volume (measured as the distance
between the left and right vertical lines of the loop), and thereby change
the cardiac output.
Heart Failure: A very reasonable definition
of heart failure is given in your textbook: "heart failure is the inability
of the heart to pump blood forward at a sufficient rate to meet the metabolic
demands of the body ("forward failure"), or the ability to do so only if
the cardiac filling pressures are abnormally high ("backward failure"),
or both.
Given that this definition is fairly broad, it follows that there are
a number of different causes of "heart failure". In general, we try to
distinguish between so-called "diastolic dysfunction", in which the left
ventricle is non-compliant resulting in impaired filling of the
ventricle, and "systolic dysfunction". Even in the absence of systolic
dysfunction, diastolic dysfunction may result in all the signs and symptoms
of backward failure, due to elevation of the LVEDP resulting in transudation
of fluid into the interstitium of the lungs. Classic examples of "pure"
diastolic dysfunction include left ventricular hypertrophy secondary to
long-standing hypertension and so-called "hypertrophic cardiomyopathy".
Both of these subjects will be covered in more depth in later lectures.
More commonly, heart failure reflects an abnormality of LV contractile
function, resulting in systolic dysfunction, and impaired emptying
of the left ventricle. It should be noted that virtually all patients with
systolic dysfunction also have some degree of diastolic dysfunction as
well, resulting from the decreased compliance of the dilated or hypertrophied
ventricle.
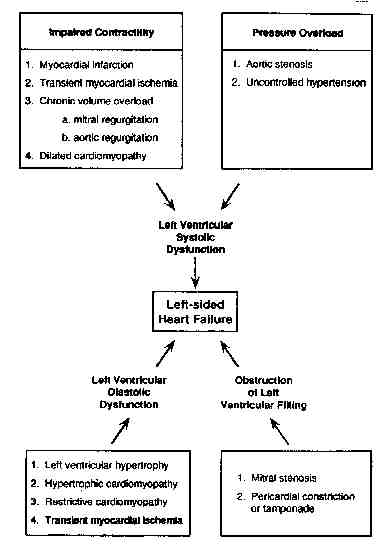
Finally, all of the signs and symptoms of heart failure can occur in the absence of true LV dysfunction of either kind, as a result of mitral stenosis (impaired filling of a normal ventricle) or pericardial constriction (impaired filling due to external pressure on the heart). All the major possibilities are nicely summarized in the diagram above, taken from page 153 of the text. Virtually all of these causes will be discussed in future lectures covering valvular heart disease, cardiomyopathies, pericardial disease, ischemic heart disease and hypertensive heart disease.
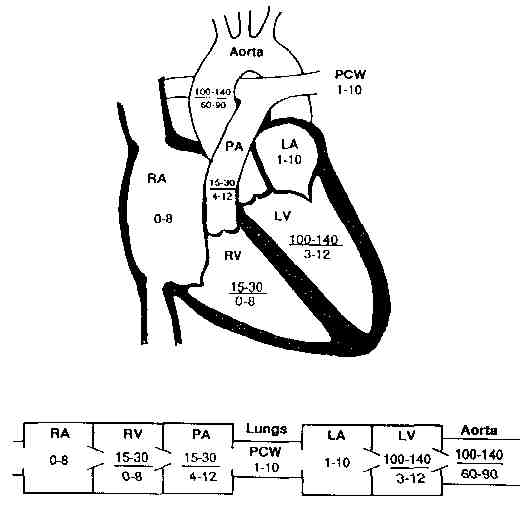
Appendix A: Normal heart pressures