The heart is a wondrous structure which manages to continuously pump an average of 5 liters of blood per minute throughout the body, through a series of complex electrical and biochemical interactions. An electrical impulse generated in the sino-atrial node quickly disperses through the heart to generate a synchronized series of contractions, first in the atria and then in the ventricles. The left ventricle serves as the main pumping chamber of the heart forcing blood through the aortic valve into the high resistance systemic circulation, providing oxygen to the entire body. When left ventricular failure occurs, initially the bodys demands may be met but at the cost of abnormally high "filling pressures" within the left ventricle. Ultimately left heart failure may result in an inability of the left ventricle to pump blood forward to meet the bodys demands, leading to organ hypoperfusion, acidosis, shock and death.
For the sake of this course, we will have to consider
an idealized heart which functions as a simple muscular pump, which can
be exposed to various filling and emptying conditions. Each single beat
of the heart can be described as one "cardiac cycle." A diagram of the
cardiac cycle, taken from page 30 of the textbook is reproduced here.
The normal cardiac cycle, showing pressure relationships between the left-sided heart chambers. During diastole, the mitral valve (MV) is open, so that the left atrial (LA) and left ventricular (LV) pressures are equal. In late diastole, LA contraction causes a small rise in pressure in both the LA and LV (the a wave). During systolic contraction, the LV pressure rises, when it exceeds the LA pressure, the MV closes, contributing to the first heart sound (S1). As LV pressure rises above the aortic pressure, the aortic valve (AV) opens, which is a silent event. As the ventricle begins to relax and its pressure falls below that of the aorta, the AV closes, contributing to the second heart sound (S2). As LV pressure falls further, below that of the LA, the MV opens, which is silent in the normal heart. In addition to the a wave, the LA pressure curve displays two additional positive deflections: the c wave represents a small rise in LA pressure as the MV closes and bulges toward the atrium, and the v wave is due to passive filling of the LA from the pulmonary veins during systole, when the MV is closed.
The cardiac cycle -- diastole and systole:
The cardiac cycle consists of two major components. Diastole is the period of left ventricular relaxation and filling, beginning with the closure of the aortic valve and ending with closure of the mitral valve. The majority of ventricular filling occurs during the first phase of diastole, the rapid ventricular filling phase. The remainder of ventricular filling occurs at the very end of diastole at which time there is atrial contraction followed immediately by closure of the mitral valve. Approximately 10 - 25% of left ventricular filling occurs during this "atrial kick" phase of diastole, during which the left ventricular end-diastolic pressure rises slightly. In "stiff" or non-compliant hearts, the "atrial kick" component of left ventricular filling is proportionately higher.
A major influence on how well the left ventricle fills is the "compliance" of the left ventricle. Compliance is defined as the inverse of stiffness (where stiffness = D P / D V and where compliance = D V / D P) i.e., a more compliant left ventricle will allow for a larger change in volume for any given change in pressure. Left ventricular compliance is described using left ventricular filling curves which plot change in volume versus change in pressure. The slope of the curve reflects the myocardial stiffness at any given point during left ventricular filling. Note that at low filling pressures, the left ventricular compliance curve is almost linear but that at higher volume and pressures it begins to curve upward more steeply. Note that the upper of these two curves represents a less compliant left ventricle, in which a higher left ventricular end-diastolic pressure is present at a given volume load. A patient may be brought from point B to point A (or from D to C) by giving a diuretic to decrease intravascular volume or by giving a venous vasodilator -- thereby increasing the capacitance of the venous system and reducing volume entering the heart.
Left ventricular systole occurs when the mitral valve closes and the left ventricle begins to contract, first through a brief period of "isovolumic contraction", immediately followed by opening of the aortic valve and the main portion of systole: left ventricular ejection. This in turn is followed by closure of the aortic valve.
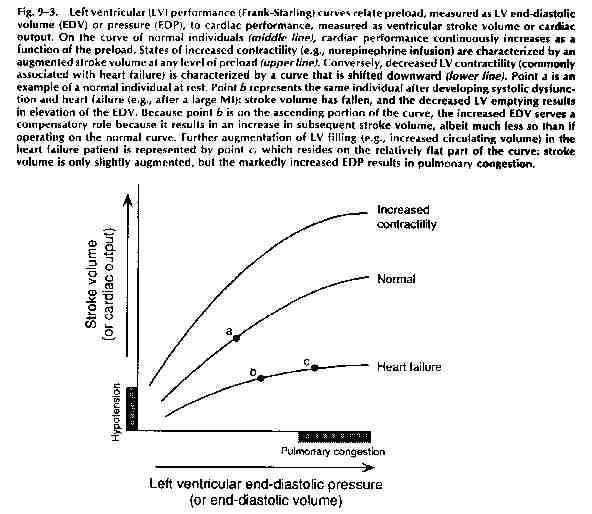
Systole can be considered the active phase of the cardiac cycle where myocardial contractility becomes the key to left ventricular performance. Left ventricular systolic performance can be graphed on a "Frank-Starling performance curve" which plots left ventricular performance, i.e. cardiac output, as related to left ventricular end-diastolic pressure (which in turn relates to the degree of filling which occurred during diastole.) A sample curve is included below:
Cardiac Output: The cardiac output, simply defined, is the net volume ejected by the left ventricle per minute, and is equal to the stroke volume times the heart rate, expressed in units of liters per minute. In turn, the stroke volume (the volume of blood ejected by the heart with each beat) is determined by a number of factors, as diagrammed below:
Each of these terms is defined in the table below, as taken from the textbook, page 150:
Table 9-1. Terms Related to Cardiac Performance
Term Definition
Preload: The ventricular wall tension at the end of diastole. In clinical terms, it is the stretch on the ventricular fibers just prior to contraction, often approximated by the end-diastolic volume or end-diastolic pressure.
Afterload: The ventricular wall tension during contraction; the resistance that must be overcome in order for the ventricle to eject its contents. It is often approximated by the systolic ventricular (or arterial) pressure.
lnotropic State
(Contractility): A measurement
of the magnitude of contractile force at a given resting fiber length.
Stroke Volume: Volume of blood ejected from the ventricle in systole (= end-diastolic volume - end-systolic volume).
Ejection Fraction: The fraction of end-diastolic volume ejected from the ventricle per beat (= stroke volume / end-diastolic volume). Normal range = 55-75%
Cardiac Output: Volume of blood ejected from the ventricle per minute (= stroke volume X heart rate).
Loading Conditions -- Preload and Afterload: The terms "preload" and "afterload" are defined as the wall tension or wall stress during diastole and during systole, respectively. What does this mean in real terms? Well...........wall tension is defined as follows:
Wall tension = P x r
2h where r = LV radius
and h = wall thickness
During diastole: the major variable which is changing is the radius of the ventricle as it fills with blood, since the radius changes in proportion to the cube root of the volume, while the pressure changes little (see the cardiac cycle diagram) and the thickness changes little. It is for this reason that, clinically, we relate preload to the degree of volume which is loading the ventricle.
During systole: the major variable which is changing is the pressure (again, look at the cardiac cycle diagram), while, relatively, the radius and the thickness of the ventricle are not changing as much. We therefore relate afterload to the pressure which the ventricle is pumping against, i.e. aortic pressure or the "blood pressure".
Note that any factor which lowers blood pressure will therefore lower afterload. Likewise, any factor that lowers left ventricular end-diastolic volume will lower preload. Also, note that a compensatory increase in left ventricular wall thickness (i.e. left ventricular concentric hypertrophy) will decrease wall tension both in systole and diastole, and will therefore decrease both preload and afterload.
Contractility: During systole, often thought of as the active phase of the cardiac cycle, the left ventricle contracts forcefully, ejecting approximately two-thirds of its contents with each beat. The force of contraction is determined by the "contractility" of the ventricle, which, in turn, varies with the length of the individual sarcomere. In general, the farther each individual sarcomere is stretched, the greater the force of contraction. There is a limit, of course, to the length which each sarcomere can be stretched, and there is a point beyond which no further incremental force will be generated.
To demonstrate the relationship between loading conditions and LV performance, a curve called a Frank-Starling performance curve can be created by plotting left ventricular end-diastolic volume (or pressure) -- i.e. preload -- versus left ventricular cardiac output -- LV performance. The position and slope of the curve reflect the contractile state of the individual ventricle at the point in time that the curve is drawn. Factors that augment the contractile state of the ventricle (i.e. adrenergic agents, positive inotropes, etc.) tend to shift the Starling curve of a ventricle upwards and to the left (see figure below).
Measurement of Cardiac Output: Well, the above curves sure look nice, but how on Earth do we obtain the values to create such a curve -- i.e. how do we measure LVEDP and how do we measure the cardiac output.
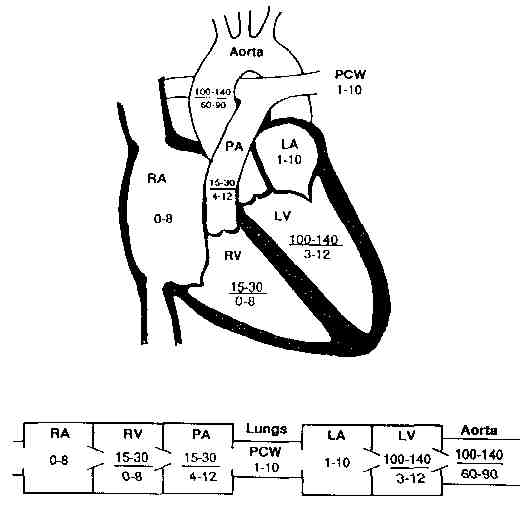
So far, the most reliable way to do both is to place a balloon-tipped flexible tube called a Swan-Ganz catheter into a vein, and thread it through the right side of the heart to the pulmonary artery. There, inflation of the balloon allows us to measure the "pulmonary capillary wedge pressure" which, in turn, reflects the left atrial pressure. Since the mitral valve is open during diastole, the left atrial pressure equals the left ventricular diastolic pressure (barring any mitral valve stenosis). We have therefore indirectly been able to measure the LVEDP.
Using the same catheter, we can estimate the cardiac output using either the Fick Principle or the "thermodilution method". In brief, the Fick principle states that the cardiac output is proportional to the patients oxygen consumption divided by the "A-V O2 difference":
Cardiac output is proportional to:
|
O2 consumption |
| A-V O2 difference |
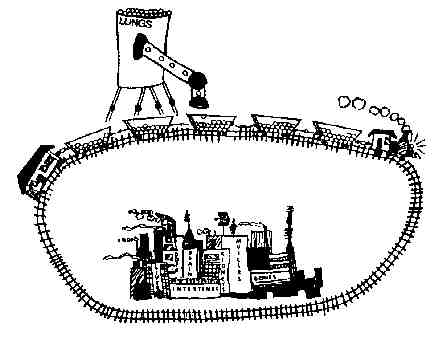
where the A-V O2 difference is the difference in the bloods oxygen saturation between where it exits the heart and where it enters the heart. In essence, the slower the blood travels through the body, the more oxygen is extracted by the bodys tissues, the greater the A-V O2 difference, and the lower the cardiac output. This is illustrated schematically below by none other than the daughter of Eugene Braunwald M.D., chairman of the Dept of Medicine at the Brigham and Womens Hospital.
Note that oxygen consumption can be measured directly or can be estimated based on a patient's age, sex and body size. A-V O2 difference is calculated by measuring blood samples from a peripheral artery (oxygenated blood) and from the pulmonary artery ("mixed venous" blood) which has been mixed together in the right ventricle.
Pressure - Volume Loops: A pressure - volume
loop graphically displays the relationship between LV pressure and LV volume
in a single cardiac cycle. These curves can be used to graphically depict
the effects of various therapies on LVEDP and stroke volume. The figures
below illustrate how changing a single parameter (i.e. afterload, preload,
or contractility) can change the stroke volume (measured as the distance
between the left and right vertical lines of the loop), and thereby change
the cardiac output.
The effect of varying preload, afterload, and contractility on the
pressure-volume loop.
A. When arterial pressure (afterload) and contractility are held constant, sequential increases (lines 1, 2, 3) in preload (measured in this case as end-diastolic volume [EDV]) are associated with loops that have progressively higher stroke volumes but a constant end-systolic volume (ESV).
B. When the preload (EDV) and contractility are held constant, sequential increases (points 1, 2, 3) in arterial pressure (afterload) are associated with loops that have progressively lower stroke volumes and higher end-systolic volumes. There is a nearly linear relationship between the afterload and ESV, termed the end-systolic pressure-volume relation (ESPVR).
C. A positive inotropic intervention shifts the end-systolic pressure-volume relation upward and leftward from ESPVR-1 to ESPVR-2, resulting in loop 2, which has a larger stroke volume, and smaller end-systolic volume than the original loop 1.
Heart Failure: A very reasonable definition of heart failure is given in your textbook: "heart failure is the inability of the heart to pump blood forward at a sufficient rate to meet the metabolic demands of the body ("forward failure"), or the ability to do so only if the cardiac filling pressures are abnormally high ("backward failure"), or both.
Given that this definition is fairly broad, it follows that there are a number of different causes of "heart failure". In general, we try to distinguish between so-called "diastolic dysfunction", in which the left ventricle is non-compliant resulting in impaired filling of the ventricle, and "systolic dysfunction". Even in the absence of systolic dysfunction, diastolic dysfunction may result in all the signs and symptoms of backward failure, due to elevation of the LVEDP resulting in transudation of fluid into the interstitium of the lungs. Classic examples of "pure" diastolic dysfunction include left ventricular hypertrophy secondary to long-standing hypertension and so-called "hypertrophic cardiomyopathy".
More commonly, heart failure reflects an abnormality of LV contractile function, resulting in systolic dysfunction, and impaired emptying of the left ventricle, with a resultant fall in cardiac output. It should be noted that virtually all patients with systolic dysfunction also have some degree of diastolic dysfunction as well, resulting from the decreased compliance of the dilated, fibrotic or hypertrophied ventricle.
Finally, all of the signs and symptoms of heart failure can occur in the absence of true LV dysfunction of either kind, as a result of mitral stenosis (impaired filling of a normal ventricle) or pericardial constriction (impaired filling due to external pressure on the heart). All the major possibilities are summarized in the diagram below, which has been taken and modified from page 219 of the text. Virtually all of these causes will be discussed in future lectures covering valvular heart disease, cardiomyopathies, pericardial disease, ischemic heart disease and myocardial infarction.
Compensatory Mechanisms in Heart Failure: Several natural compensatory mechanisms are "called into action" in heart failure, in an effort to counteract the effect of falling cardiac output on perfusion to vital organs. These mechanisms include:
-- The Frank Starling mechanism, in which cardiac output is increased at the expense of a rise in LVEDP (left ventricular end-diastolic pressure), which in turn may lead to pulmonary congestion. For example, the patient who was originally at point A on the upper curve sustained a myocardial infarction, resulting in mild LV systolic dysfunction, and changing his Starling curve to the middle curve below. He was able to augment his forward cardiac output to its previous level, by moving from point B to point C on the curve, but at the expense of a significantly increased LVEDP.
-- Neuro-humoral compensations, including activation of the adrenergic nervous system and the renin-angiotensin system and increased secretion of ADH (anti-diuretic hormone) all occur in the face of a reduced cardiac output, in order to maintain blood pressure (and thereby perfusion to vital organs) and to augment cardiac output. These factors result in an increase in preload (by causing fluid retention and venous constriction) and an increase in heart rate and contractility, thereby raising cardiac output -- but at the expense of an increase in myocardial oxygen demand and an increase in afterload. The diagram below illustrates the effects of these neuro-humoral compensatory mechanisms:
Finally, chronic compensatory mechanisms for heart failure include structural alterations in the heart muscle, such as concentric left ventricular hypertrophy (LVH) which occurs in patients with long-standing hypertension and aortic stenosis and eccentric left ventricular hypertrophy in which the LV cavity dilates and LV mass increases as a result of chronic volume overload states (such as chronic mitral regurgitation or chronic aortic regurgitation). Patients who sustain large myocardial infarctions may also develop post-infarction left-ventricular "remodeling", during which the area of infarct dilates disproportionately and results in worsening systolic dysfunction as well as predisposing to life-threatening cardiac arrhythmias.
Learning objectives for this topic:
The cardiac cycle
Compliance curves
Preload and afterload
Components of and determination of cardiac output
Frank-Starling curves
The Fick Method
Pressure-Volume Loops
Diastolic versus systolic dysfunction
Definition of backward and forward heart failure
Causes and mechanisms of heart failure
Compensatory mechanisms in CHF
Appendix A: Normal heart pressures