Lab
7: Vibration analysis and Young's modulus with strain gauges on fiberglass
update 2007
Background: Bone
is a composite material: It is a calcium mineral held together with collagen
fibrils. Bone has some material similarities to fiberglass. Fiberglass is long
glass fibers held together with epoxy. In Lab 7 you will study the stress -
strain relationship of fiberglass fitted with strain gauges.
You encountered stress-strain
curves in your materials course, and here you will use strain gauges to measure
Young's modulus and the vibration frequency of a fiberglass plate clamped at
one end.
You will look at transient
bending responses with the 54622A digitizing scope. The Math/FFT feature of
the 54622A will be able to show you the spectrum of the vibration waveform.
You will need to use the
trigger feature of the scope to capture the vibration transient. You can also
use LabVIEW to acquire the waveform, and analyze it.
Requirements:
Use one of the fiberglass members with a pair of strain gauges epoxied to the
opposite sides, and connected to terminal blocks. From the terminal blocks send
wires to create a Wheatstone bridge and monitor the voltage across the bridge.
Measure the length, width and thickness of the fiberglass relevant to
the stresses you will put on it. The wires and their connections
from the cable to the strain gauges are delicate and should not be touched or
moved unnecessarily! Report to a TA if you see broken wires on your fiberglass
system.
(1) For 2007 you will use
fiberglass with 120 or 350 ohm strain gauges. Verify that the strain gauges
are 120 ohms, and determine which are longitudinal, and which are transverse,
by clamping and bending the fiberglass while measuring resistance changes.
(2) Arrange the 4 SGs into
a Wheatstone bridge that will be selective for bending. Have the
outputs of the bridge go to the + and - inputs of a 524, set for gain or 1000.
Choose an appropriate excitation voltage for your bridge. Check that the two
sides of the unloaded bridge have v. similar voltages, so their difference is
less than 10mV.
(3) Clamp the fiberglass in a vise near the Wheatstone bridge breadboard, paying
attention to the length of the structure free to vibrate. Observe on the scope
a decaying oscillation of Vout when you "ring" the bar by flexing
it on its end. Understand triggering on the 52622A scope enough that you can
capture as a single trace one of the transient oscillation bursts due to flexing
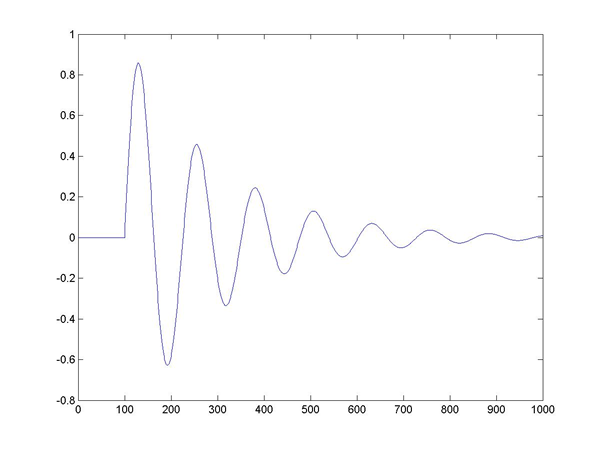
of the of your rod. Record the frequency of oscillation, and the time constant
of decay of the burst. See Matlab-generated figure below.
How do the frequency and time
constant change if you shorten the length of rod free to vibrate? (What
is the formula for the oscillation period of a pendulum? Use dimensional analysis.)
(4) As you did in Lab 6, invoke the Math/FFT feature of the 54622A scope to
look at the spectrum of a single waveform. Does the spectrum tell you
the fundamental frequency of oscillation? Does the spectrum result agree with
the time base measurement of of oscillation frequency?
Note on bending moment of a bar thickness (height) h,
width w, is I_x = w*h^3/12
(from EN31 notes...)
http://en.wikipedia.org/wiki/Second_moment_of_area
(5) Next, change the arrangement
of the strain gauges in the bridge to be selective for longitudinal tension.
Hang the fiberglass bar from the vertical "ring stand" rod provided,
with a weight tray hanging from the bottom of the fiberglass. Record the DC
voltage of the arrangement with no extra weight on the tray. Compare to the
voltage after a 5kg load is placed in the tray.
Consider these equations from
the strain gauge lecture notes,
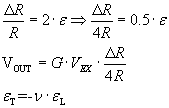
and compute for 4 gauges, with an approx. Poisson's ratio for fiberglass
of 0.25, what the strain is, given the 524 output voltage (with unloaded voltage
subtracted). Knowing the strain on the fiberglass, what is your estimate of
the Young's modulus of the fiberglass? How is stiffness related to Young's modulus
or modulus of elasticity for the material? You
may find modulus of elasticity values at http://www.matweb.com
or http://www.amalgacomposites.com/eng_mp.htm
or http://www.bedfordplastics.com/pdf/06510%20First%20Source.pdf
(6) Temperature effects: try
heating near one of your unloaded strain gauges with a hair dryer. Do you detect
any change from the unloaded strain gauge amplifier DC output? How should heat
affect the strain gauge, mechanically? electrically?
(7) Send the output of the
instrumentation amp to an analog input channel of LabVIEW, and thence through
LabVIEW's FFT Power Spectrum analyzer (Mathematics:Signal
Processing:Spectral Menu with GRAPH,
NOT CHART waveform for display): Do you see the same spectrum
in LabVIEW that you saw on the 54622A? What is a good sampling rate to capture
the vibration frequency?
Establish a trigger
in your LabVIEW VI: Arrange that after you start your VI it waits until a threshold
is exceeded in the input waveform before starting to acquire one second worth
of vibration. Remember what you did in Lab 0.5, to have one process trigger
another. Try to build your trigger system with a SEQUENCE: in one of the sequence
frames wait for the trigger event, in the other frame complete the spectrum.
Possible FTQ: In a perfect world, you've passed the strain gauge quiz:
no FTQ here...
IP folder: Place an
Excel Spreadsheet in your IP folder that records the oscillation frequencies
and time constants of decay of the major and minor frequencies, at 2 different
bar lengths; and show in Excel your calculation of Young's modulus from the
Vout and Vex of your bridge and Inst Amp.
Free Advice: Read the lectures notes on strain gauges from the
EN123 website (and archive site). Make it so: that the bridge output heading
to the 524 pins 1 and 2 is less than 10 mV, so gain 1000 does not saturate the
amplifier output!