Background: An electrode near nerve cell processes can record what physiologists call action potentials (APs): transient changes in voltage due to the opening and closing of membrane channels that allow passage of ions such as sodium, potassium, calcium or chloride. Even removed from the body of a roach, the sensory fibers in a leg can can function for more than 3 hours. In this lab you will use needle electrodes to record extracellular AP "spikes" that are spontaneous and/or correlated with joint flexion or leg "spine/spur" stimulation. You will collect data with a multipoint Analog IN icon feeding a Matlab script that will compute total spike count and maximum rate.
In Lab 8 the sensors of joint angle or spur stimulation are live nerve cell endings that change internal voltage due to mechanical stress. They convert voltage changes into pulse frequency, acting as voltage controlled oscillators.
Lab 8 will take place in room B-20 in Arnold Lab, before (home of Neuro 160, taught by John Stein); a 123 team will be accompanied by JDD, bringing the subject, Blaberus. "Adult size, 5 to 6 cm. Common to tropical America. Also known as the palmetto bug or the death's head bug, the Blaberus is the largest cockroach in the US." from Carolina Biological.
B-20 has
six Gateway computers with the current edition of LabVIEW installed. Each Gateway
has a 6024E DAQ card, and a BNC version of the green connector block. (acct:
your author id: e.g. jdaniels; password: ****2447)
Requirements:
As you will have
seen in the B-20 Lab 8 class demo, you (or we) will (1) anesthesize a roach
with cold (2) amputate one of its back legs and place the leg on flat white
paper on a dissection tray. Pin the leg down at the proximal joint with a dissecting
pin. Clean two needle electrodes with emory paper and insert them into the exoskeleton
at the segment of the leg above the spurs (smooth exoskeleton, thigh. "femur"),
with 2-4 mm distance between electrodes. Make sure not to pierce the needles
into the joints themselves.
(1) Before you go to the B-20 Lab, create a VI that can detect total spike count and peak rate (1/t-min) of response during a 1 second interval.
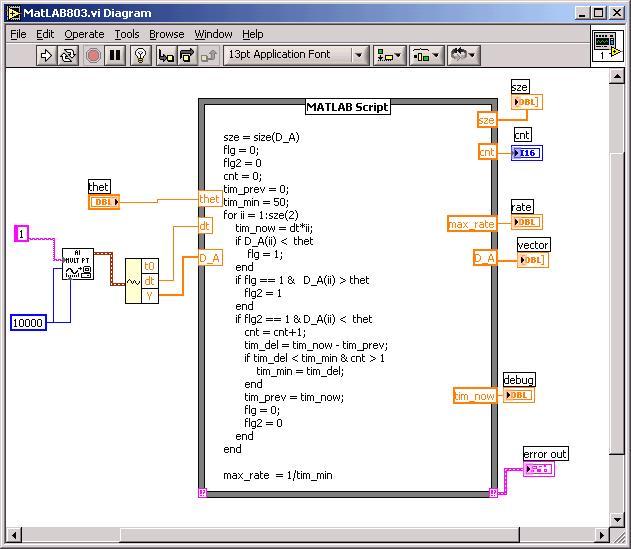
Matlab Help: Below is the diagram of a VI that acquires 1 second of a waveform at 10000 Hz sampling rate, then passes the waveform on to a Matlab script that, in a loop, threshold discriminates, counts pulses, and finds a peak rate. Note that the VI also reports the total count!
The Matlab script above looks for threshold, not window discrimination, but entered correctly, it does work. You will want to add a waveform graph to your front panel that takes as input the output of the AI Mult Pt read icon, so you can what to set your your threshold thet to, after acquiring spike data.
The code in the script above can be found in the EN123_IP_20YR folder in My Documents on the 095, 097 machines as read-only file Lab8script.m. To save yourself some typing, open that file...there below the initializing lines is the code to copy and paste. If you run Lab8script.m in Matlab you can single step through and watch what it does. If you rename it and take off the read-only restriction you can work on the window discriminator feature in Matlab itself.
Read about how to use the Matlab Function icon in LabVIEW: (Math Function menu choice). Understand how to add INPUT and OUTPUT to the script icon. Study the script above: try to see what the for loop is doing, and how the max_rate is computed. Note that the script as written uses one threshold only, not two as needed by a window discriminator.
Your main problem may be debugging your script without the full Matlab support of breakpoints. You can help yourself by sending variables to the front panel. See the "debug" output on the diagram above. Use JD as a debugging tool if you like, or copy all the text to a Matlab script file, add at the top of the file thet, dt and D_A inputs, and single-step in Matlab.
As you build up your script, try running it. Make sure you attach the error message in the bottom right hand corner. In the script above ordinary words are deliberately misspelled: flag is a function in Matlab... The size function can have 2 or more outputs, making it a vector. On the Inputs and Outputs designated on the edges of the icon you need to declare them as real vectors.
You
should add hysteresis to the threshold detector:
if flg2 == 1 & D_A(ii) < 0.95*thet
to avoid extra counts around thet...
If you see an error message in the front panel, start removing code or inputs or outputs until you return to an error-free condition...
In the MAX utility you can with Analog In see the approximate size of your signal, to know where to set thet, the threshold.
Create and test your Matlab script VI in 095 before going over to Arnold Lab: Use a 100 Hz 20% duty cycle 0-2v amplitude pulse waveform as your test input.
NOTE ABOUT LABVIEW RUNNING MATLAB: IF YOUR VI CONTINUALLY GIVES MATLAB ERRORS AND THERE IS NO OBVIOUS FAULT IN THE CODE, TRY QUITTING BOTH LABVIEW AND MATLAB, THEN RESTARTING ONLY LABVIEW, AND YOUR VI, AND LETTING LABVIEW OPEN AN INSTANCE OF MATLAB THAT WILL BE PROPERLY "ATTACHED" TO LABVIEW. IT IS POSSIBLE TO BE RUNNING AN INSTANCE OF MATLAB THAT HAS NO LINK TO LABVIEW RUNNING AT THE TIME.
What about using Lab 0.5 window discriminator for this Lab? In principal that would be good, and all you need...The practical problem turns out to be that Lab 0.5 did a single point read of input so it could evaluate in "real time" any threshold crossings. If you count the number of single point reads that can be done in one second in LabVIEW the answer turns out to be about 1600. 1600 then would be your SAMPLE RATE, resulting in Nyquist rate of 800 Hz. The action potential contains information up to the 3KHz range, so the sample rate of a single point read in a while loop is a little low.
But if you set the A-M Systems amplifier LP filter to 1000 Hz cutoff, you can try your Lab 0.5 without "too much" aliasing... One improvement is needed (assuming your window discriminator already counts valid events): Design a "rate meter" so you can look for the maximum rate (minimum time between events).
Below is a
suggestion for how to implement that feature, and a timer. The clock icon keeps
time in msec. Note the rate meter does NOT pick off the maximum rate: How can
that be done?
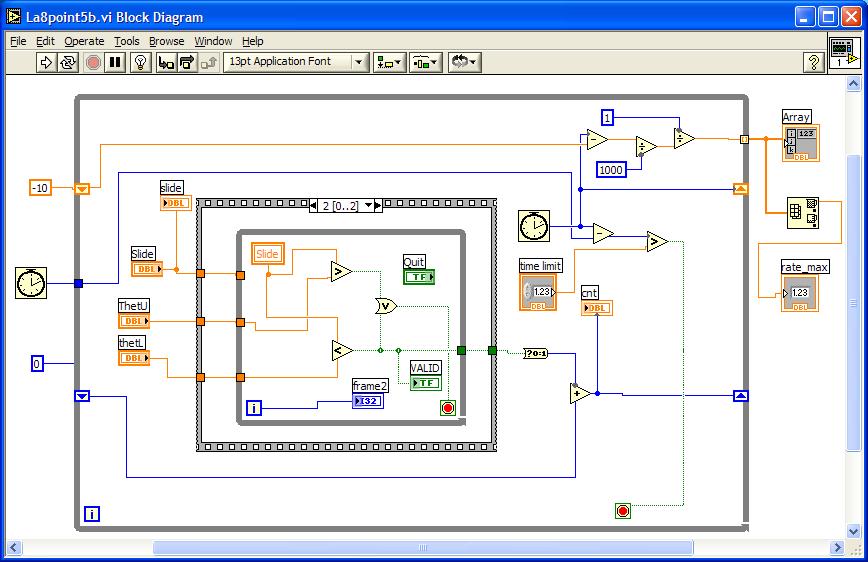
Annoyingly, because the timer icon is good to the nearest msec only, the rate
meter is rather crude for higher rates: 1000Hz, 500Hz, 333H, 250Hz, etc.
YOU WILL HAVE TO BRING YOUR VI OVER to B-20 ON A USB port MEMORY STICK, OR EMAIL IT TO YOURSELF.
2008-11: You will need to Save with Options for LabVIEW 7.0 since the machines in B-20 run 7.0, while we run 7.1, which, annoyingly, is not compatible with 7.0...
After verifying that you see and hear multi-unit activity, swing into position the Wild 6X dissecting microscope and observe the "spurs" as you stimulate them with (say) a sharpened plastic straw: Which way does a spur bend? can you associate individual spurs with a single unit? Is the response of a single spur graded as to stimulus intensity? (spikes/sec vs amount of bending). Are responses to sudden spur bending sustained or transient? Hold the tip of the stimulus stick on the white paper and rotate the stick into a spur to be able to test for sustained responses to deflection.
(2) Before the amputation: set up the electronics in B-20: Attach clip leads that take the signal from the needle electrodes to the A-M Systems preamp recording head, and thence to the A-M Systems amp in the rack. Set HP filter to 100Hz and LP to 5000Hz, and gain to 1000. The A-M output goes to the Tektronix 5110 scope, where you should set the vertical gain to about 20mV. Turn on audio monitor. Out of the back of the scope is an output that will feed to Harvard Apparatus audio amplifier/speaker, and go to an Analog Channel of the BNC connector box for LabVIEW. Thus changing gain on the scope will change the size of the signal to the audio monitor and LabVIEW. Changing vertical position on the scope will move the DC level of the LabVIEW signal, too.
(3) Test the impedance of the electrode pair by inserting the electrodes into the roach leg or into saline-soaked blotter paper (or a piece of pumpkin!) then turning the A-M preamp from REC to IMP. You should see about 2 mV p-p 500 Hz sinewave if your electrodes are making good connections.
Establish a low noise recording you can listen to. Is the 60Hz noise minimized? Make sure the metal of the dissecting tray is grounded, and the shielding of the electrode pair is grounded.
(4) The roach can be anaesthetized
in a cold atmosphere. One way: from dry ice coming in contact with water. Use
sharp scissors for the amputation. Place the leg on printer paper on a dissection
tray. Use a dissecting needle to hold the leg in place on the proximal side.
Pierce the "thigh" exoskeleton with the needle electrodes, at about
2-4mm spacing. Turn up the audio sound and listen for multiunit nerve activity.
See how the sound changes if you turn to different HP filter settings.
Evaluate spontaneous and evoked
activity. Stimulate the leg by extending and flexing the "knee" joint.
Touch the leg spines/spurs with a camel's hair brush, or blow air on the feeler
at the end of the leg. Make sure you ground yourself by touching the metal
plate inside the Faraday cage.
We will be particularly interested if you can detect directionally selective responses for flexion and extension of the joint: meaning: Response is better to one direction of rotation than to the other. Try to estimate the maximum "firing rate" in Hz of the units you listen to and watch on the scope.
(5) Use LabVIEW utility MAX
to look at the analog channel input to LabVIEW sent from the back of the 5110
scope. Try to select a good threshold while watching evoked activity on the
Test Panel analog IN channel strip chart.
It will be useful on your VI to have a waveform
graph as a function of time to see reasonable threshold levels...
(6) What to show us:
Measure spontaneous and evoked counts.
Try to assess variability to repeated stimulations. See if you can hear more than
one distinct unit contributing to the response. Listen for transient and sustained
responses to stimuli.
Run the signal from the roach leg, to the needle electrodes, through the amplifier and filters, to the scope, the audio monitor and into LabVIEW. Collect 1 second worth of data, with evoked and spontaneous trials. Adjust for best threshold. Have a VI process the signal to count events that exceed the threshold, and report peak rate. See if you can demonstrate direction selectivity in knee joint rotation, or direction of stroking leg bristles.
About peak rate: If you were recording from one nerve cell only, you'd expect the peak rate to be less than 1000Hz. But your electrodes are recording from several units simultaneously. Depending on the threshold you set, you may see something like a half-dozen units. So if two different units fire v. near each other in time, your recorded peak rate may be greater than 1000Hz. If you set a high enough threshold (or narrow enough window) so that you are recording from only the unit with the greatest amplitude, your peak rate should be less than 1000Hz.
See what happens to unit activity if you extend the joint to near its limit, or flex to "jack-knife" closure. Can you hear one unit firing for extension, and a different one for flex?
Calibration: Back
in the 095 lab you should show us that your counting and max_rate report the
correct numbers for a calibrating pulse train from the waveform generator.
FTQ:
You will be asked to add to the code to the Matlab script for window discrimination
capability. Likely you will need another threshold, thet_up, and another
flag, flg3.
If D_A(ii) > thet_up,
flg3
= 1;
end
Later when
the test
D_A(ii) < thet_up & flg2 == 1
is encountered you will also test flg3; if flg3 == 1 then skip incrementing
cnt. Should you also reset flg2 to 0 if flg3 == 1 ?
When to reset
flg3? One way: reset flg3 at the beginning of ii loop:
if flg2 == 0
flg3 = 0;
end
Since flg2 will be 1 after thet is crossed, and will be reset on successful cnt increment or detection of flg3 itself. You can add the window discrimination in the lab, and use "cardiac" waveform to move your window over a lower level part of the cardiac waveform...
We will test your window discriminator by first setting thet_up to a large value and seeing the same result as threshold detection. Then we will lower thet_up until the spike count decreases, finally going to 0.
Scoring: +2 points for being the first to finish the lab, 1 pt for second...