John Stein dwg/Vedika C. photo
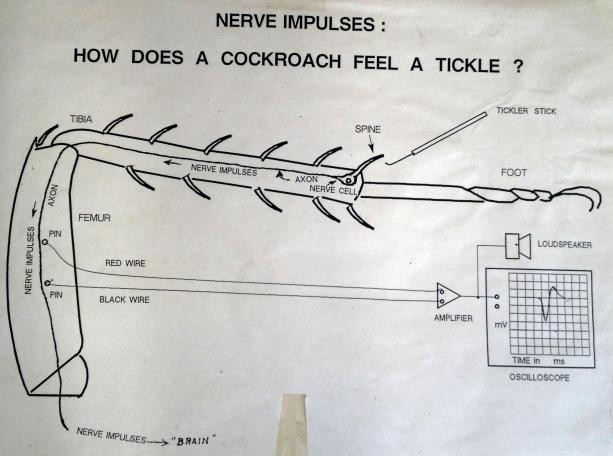
Background: An electrode near nerve cell processes can record what physiologists call action potentials (APs): transient changes in voltage due to the opening and closing of membrane channels that allow passage of ions such as sodium, potassium, calcium or chloride. Even removed from the body of a roach, the sensory fibers in a leg can can function for more than 4 hours. In this lab you will use needle electrodes to record extracellular AP "spikes" that are spontaneous and/or correlated with joint flexion or leg "spine/spur" stimulation. You will collect data with a multipoint Analog IN icon feeding a Matlab script that will compute total spike count and maximum rate.
In Lab 8 the sensors of joint angle or spur stimulation are live nerve cell endings that change internal voltage due to mechanical stress. The nerve cells convert voltage changes into axon pulse frequency--acting as voltage controlled oscillators.
Lab 8 subject:Blaberus.
"Adult size, 3 to 6 cm. Common to tropical America. Also known as the
palmetto bug or the death's head roach, Blaberus is the largest cockroach in
the US." from Carolina Biologicals,
www.blaberus.com.
Greg's Exotics in Yucca Valley CA http://www.gregsexoticinverts.com/
"Kyle" from Dearborn, Mich, of http://www.roachcrossing.com/
(our current supplier). We have blaberus craniifer and
blaberus discoidalis, eating basil and arugula...
John Stein dwg/Vedika C. photo
Requirements:
As you can see
in the 095 Lab 8 demo, JDD will (1) anaesthetize a blaberus with cold; (2) amputate
one of its large caudal legs; (3) place the leg on an small square of white
paper on the clear silastic block in the copper pocket on an adjustable vise
pivot in a copper screen Faraday cage; (4) impale the "femur" area
with 3 sharp electrodes (needles in a Paul-Waltz-designed rig that electrically
connects the needles to Red, White and Black 24g stranded wires that go to capacativly-coupled
524 inputs, and ground. The 524 + 353 amplify by 10,000X the spikes+noise. The
spike rates show response to mechanical stimulation of the distal spines on
the leg.
(1) Before you start, create a VI that can detect total spike count and peak rate (1/t-min) of response during a 1 second interval.
Matlab Help: Below is the screen shot of a VI that acquires 1 second of a waveform at 10000 Hz sampling rate, then passes the waveform on to a Matlab script that, in a loop, threshold discriminates, counts pulses, and finds a peak rate. Note that the VI also reports the total count!
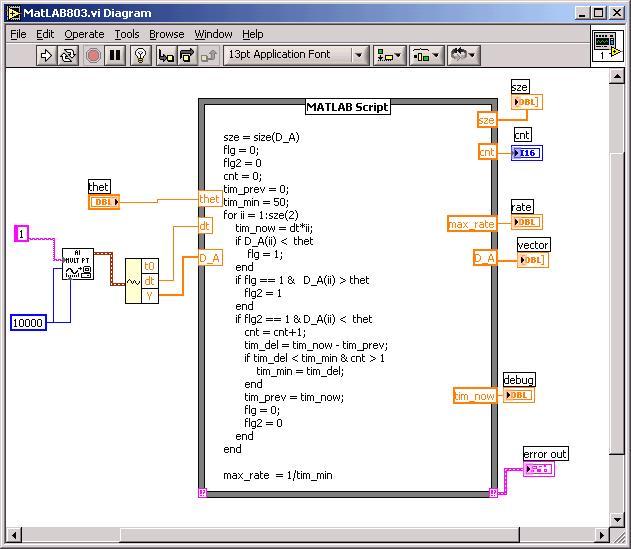
The Matlab script above looks for threshold, not window discrimination, but entered correctly, it does work. You will want to add a waveform graph to your front panel that takes as input the output of the AI Mult Pt read icon, so you can what to set your your threshold thet to, after acquiring spike data.
The code in the script above can be found in the EN123_IP_YR folder in My Documents on the 095, 097, 092 machines as a read-only file Lab8script.m. To save yourself some typing, open that file...there below the initializing lines is the code to copy and paste. If you run Lab8script.m in Matlab you can single step through and watch what it does. If you rename it and take off the read-only restriction you can work on the window discriminator feature in Matlab itself. We will use only the "driverless" Uncle Sam NW computer in 095 for Lab 8, and it will be dedicated to Lab 8 until all have completed it (and 8T, if interested). .
Read about how to use the Matlab Function icon in LabVIEW: (Math Function menu choice). Understand how to add INPUT and OUTPUT to the script icon. Study the script above: try to see what the for loop is doing, and how the max_rate is computed. Note that the script as written uses one threshold only, not two as required by a window discriminator.
Your main problem may be debugging your script without the full Matlab support of breakpoints. You can help yourself by sending variables to the front panel. See the "debug" output on the diagram above. If you copy all the text to a Matlab script file, add at the top of the file thet, dt and D_A inputs, you can single-step in Matlab itself.
As you build up your script, try running it. Make sure you attach the error message in the bottom right hand corner. In the script above ordinary words are deliberately misspelled: flag is a function in Matlab... The "size" function can have 2 or more outputs, making it a vector. On the Inputs and Outputs designated on the edges of the icon you need to declare them as real vectors.
You
can add hysteresis to the threshold detector:
if flg2 == 1 & D_A(ii) < 0.95*thet
to avoid extra counts due to signal noise as the threshold is crossed (debouncing...).
If you see an error message in the front panel, start removing code or inputs or outputs until you return to an error-free condition...
In the MAX utility or from your front panel Waveform Graph you can see the approximate size of your signal, to know where to set thet, the threshold.
Create and test your Matlab script VI before setting up blaberus: Use a 100 Hz 0-2v amplitude "cardiac" waveform as your test input.
(2)
(a)
On the optical table in 095
(b) in a Faraday cage,
(c) the red and white electrodes will be sent to
(d) low-frequency HP filters (C-R circuit, with capacitor blocking DC...)
(e) then to the inputs of a 524 amplifier set to gain of 1000
(f) then to a 353 op amp set for gain of 10
(g) then to the input of a equalizer (TEAC filter bank)
(h) then to (i) an audio amplifier + speaker, (ii) Oscilloscope (iii) LabVIEW
analog input by the "skyhook" yellow and blue wires.
The
524 is battery-powered by 2 12 volt lead acid batteries that can be recharged;
battery power reduces 60 Hz noise in the signal.
You will want to make sure the sound from the speaker is a white noise hiss with no 60Hz noise, or high frequency spike sounds. Adjust the equalizer filters. The only sound you're listening for is of spikes in response to mechanical stimulation. (There may be spontaneous activity in a few cases of electrode placement.)
The signal you see on the optical table scope will be "AC"; in LabVIEW you will be acquiring a "DC" signal. Add a digital highpass filter after the "multipoint scan" and before display or input to Matlab script. Suggestion: Choose a Butterworth HIGH Pass at 5Hz (read fine print on Butterworth: LP input for HP freq...). Send the filtered output to "A_D" input; find input "dt" from a breakout of the unfiltered waveform. Your low-frequency high-pass filter will eliminate low freq drift in your signal...
NOTE ABOUT LABVIEW RUNNING MATLAB: IF YOUR VI CONTINUALLY GIVES MATLAB ERRORS AND THERE IS NO OBVIOUS FAULT IN THE CODE, TRY QUITTING BOTH LABVIEW AND MATLAB, THEN RESTARTING ONLY LABVIEW, AND YOUR VI, AND LETTING LABVIEW OPEN AN INSTANCE OF MATLAB THAT WILL BE PROPERLY "ATTACHED" TO LABVIEW. IT IS POSSIBLE TO BE RUNNING AN INSTANCE OF MATLAB THAT HAS NO LINK TO LABVIEW RUNNING AT THE TIME.
What about using Lab 0.5 window discriminator for this Lab? In principal that would be good, and all you need...The practical problem turns out to be that Lab 0.5 did a single point read of input so it could evaluate in "real time" any threshold crossings. If you count the number of single point reads that can be done in one second in LabVIEW the answer turns out to be about 1800. 1800Hz then would be your SAMPLE RATE, resulting in Nyquist rate of 800 Hz. The action potential contains information up to the 3KHz range, so the sample rate of a single point read in a while loop is a little low.
Below is a
EXTRA-CREDIT suggestion for how to implement that feature, and a timer. The
clock icon keeps time in msec. Note the rate meter does NOT pick off the maximum
rate: How can that be done?
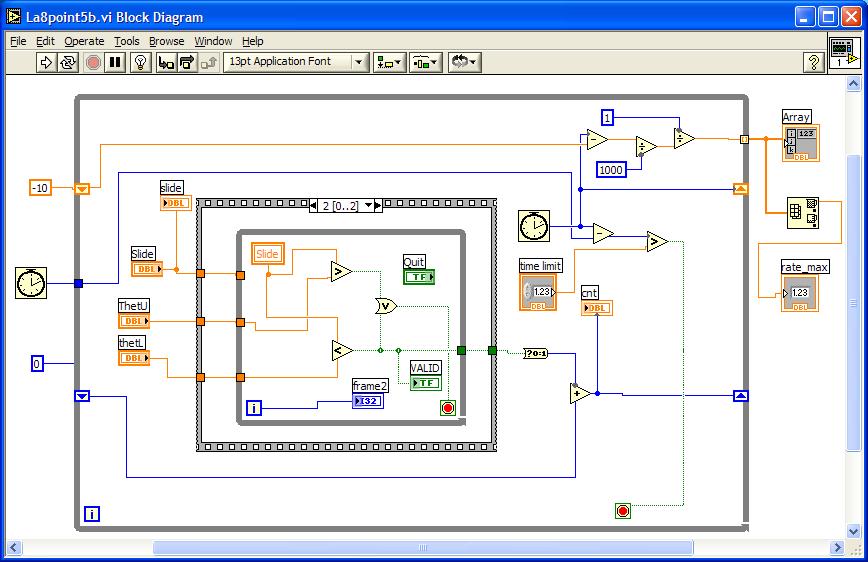
Annoyingly, because the timer icon is good to the nearest msec only, the rate
meter is rather crude for higher rates: 1000Hz, 500Hz, 333Hz, 250Hz, etc.
After
verifying that you see and hear multi-unit activity, swing into position the
AO dissecting microscope and observe the "spines" as you stimulate
them with (say) a sharpened plastic straw:
Which way does a spur bend? Is it "spring-loaded"?
Can you associate individual spurs with a single unit?
Is the response of a single spur graded as to stimulus intensity? (spikes/sec
vs amount of bending).
Are responses to sudden spur bending sustained or transient?
(3) You may be able to
measure the impedance of the electrode pair by soaking the white paper in saline
then running the scope "probe comp" through a 10M-ohm resistor to
the non-ground of the electrode set.
Evaluate spontaneous and evoked
activity. Stimulate the leg by extending and flexing the "knee" joint.
Touch the leg spines with a camel's hair brush, or blow air on the feeler at
the end of the leg. Make sure you ground yourself, to minimize noise.
Notice through the dissecting microscope that a spine seems to be a torsional spring, and has a preferred dirction to be active. There is one special spine at the joint that is there to sense joint angle. Flex one spine and record the response.
Notes: Run the signal from the roach leg, to the needle electrodes, through the amplifier and filters, to the scope, the audio monitor and into LabVIEW. Collect 1 second worth of data, with evoked and spontaneous trials. Adjust for best threshold. Have a VI process the signal to count events that exceed the threshold, and report peak rate. See if you can demonstrate direction selectivity in knee joint rotation, or direction of stroking leg bristles.
The base of the optical table is connected to power company ground from above; all other grounds (Faraday cage, Power Supply, Scope, copper stand, dissecting microscope boom, charging power supply, blue wire LabVIEW reference...) are connected to the optical table base.
Use LabVIEW utility MAX to look at the analog channel. Try to select a good threshold while watching evoked activity on the Test Panel analog IN channel strip chart. It will be useful on your VI to have a waveform graph as a function of time (2 sec) to see reasonable threshold levels...
About peak rate: If you were recording from one nerve cell only, you'd expect the peak rate to be less than 1000Hz. But your electrodes are recording from several units simultaneously. Depending on the threshold you set, you may see something like a half-dozen units. So if two different units fire v. near each other in time, your recorded peak rate may be greater than 1000Hz. If you set a high enough threshold (or narrow enough window) so that you are recording from only the unit with the greatest amplitude, your peak rate should be less than 1000Hz.
See what happens to unit activity if you extend the joint to near its limit, or flex to "jack-knife" closure. Can you hear one unit firing for extension, and a different one for flex?
Calibration: You should show us that your counting and max_rate report the correct numbers for a calibrating pulse train from the waveform generator.
(4)
Preview of Lab 8T: Manual Control of Thor linear actuator. If the Thor linear
actuator has a probe on its its cylindrical "armature" then manually
position the probe tip near a spine, and use the manual turning knob at the
back of the motor to push the spine with the tip. Is the audio response transient
or sustained? Does the spine response with a higher spike rate to a faster deflection,
or is the response only about the deflection angle?
Possible FTQs: (1) Add code to your Matlab script to create a window discriminator; It will work on either spikes rising above the noise, or spikes falling below the noise.
(2)
Code
for a slightly more involved discriminator of a biphasic spike waveform:
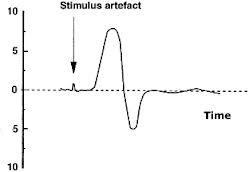
For the waveform above, say thet_up = 3 and thet_down
= -3.
Consider the logic below:
While1: sig < 0?
if so, While2: sig > thet_up?
if so, While3: sig < 10 && sig < thet_low? (if sig > 10, return
to While1)
if so, While4: sig > -10 && sig > (0.9)*thet_low?
if so, count and time-stamp the event then return to While1...
HINTS for
FTQ (1)
You will need another threshold, thet_up, and another flag, say flg3.
If D_A(ii) > thet_up,
flg3
= 1;
end
Later in the
code when the test
D_A(ii) < thet_down & flg2 == 1
is encountered you will also test flg3; if flg3 == 1 then skip incrementing
cnt.
Should you also reset flg2 to 0 if flg3 == 1 ?
When to reset
flg3? One way: reset flg3 at the beginning of ii loop:
if flg2 == 0
flg3 = 0;
end
... flg2 will be "1" after thet is crossed, and will be reset on successful cnt increment or detection of flg3 itself. You can add the window discrimination in the lab, and use "cardiac" waveform to move your window over a lower level part of the cardiac waveform...
With blaberus, we will test your window discriminator by first setting thet_up to a large value and seeing the same result as threshold detection. Then we will lower thet_up until the spike count decreases, finally going to 0.
Once the basic results are assessed, you're welcome to try any other stimulus-response experiments as you see fit.