 |
|
Opportunity
and Chance:
The Introduction of Sampling Techniques in Portugal
Nuno
Luís Madureira
ISCTE, Lisbon, Portugal
[email protected]
Abstract
In the Republican State, the idea of social reform brought about new
languages and new attitudes with respect to misery and poverty. Private
situations became not only public problems but also social priorities.
Sampling methods were adopted as a technique that allowed the transposition
of particular situations to universal problems, abstracted from individuals
and summarized in synthetic numbers. Sampling was a device for the acquisition
of knowledge, with low information costs, but also for the conversion
of knowledge into guidelines for government action. This paper examines
the evolution of sampling techniques in Portugal considering four levels
of analysis: the politics of government, the meaning acquired by statistical
figures in the perception of society, the uses of numbers by social
groups and class associations, and the innovations introduced by the
development of mathematical statistics (Bowley, Fisher and Neyman) in
applied science.
Keywords
Scientific
culture and political culture, history of statistics, government techniques,
social meaning of index numbers, disembodiment of knowledge, opportunity
sampling and random sampling
Sampling
techniques were used in government surveys undertaken at the beginning
of the 20th century. Thanks to this innovation, data collection methodologies
began to involve a choice not only of the type of facts to be recorded
and the field of possibilities associated with those facts, but also of
information extraction processes and "laboratory" control of
results. The question of material survey conditions was subordinate to
the question of the representativeness of the information obtained. The
sense of things shifted from the honest search for occurrences to the
search for representative occurrences. The reliability of surveys began
to be relative not only to the situation in which the questions were asked,
but also to the selection of respondents and the number of useful answers.
These were changes in both accepted ways of thinking and of acting, to
the knowledge of agents and the modus operandi of institutions. In such
a context, it is particularly interesting to analyse the logic that came
to serve as the justification for the sampling criteria: How were the
political arguments and the scientific arguments weighted? What roles
were played by institutional structures, political and administrative
priorities and government objectives in the choice of what was taken to
be representative? Could there be partial information extraction units,
capable of suitably representing the social whole, without the legal recognition
of the State? What was the role played by information costs in determining
sampling methods?
In order to answer these questions, we shall examine the various stages
in the diffusion of sampling procedures in Portugal, distinguishing between
their first appearance, the phase of their consolidation and subsequent
transformation.
Social Reform and Single Numbers
In March 1916, Germany’s official declaration of war brought an end
to the uncertainties of diplomacy and made it necessary for the Portuguese
government to prepare for war in terms of its own logistical apparatus,
as well as ensure social support. With the formation of the “Sacred
Union” government, Afonso Costa and António José de
Almeida sought to cement together a social block that was capable of guaranteeing
stability for the country’s participation in the First World War
and reserving a place for Portugal at future peace negotiations. The “national”
strategy did not, however, heal the wounds that had been opened earlier,
and the government remained under fire from the unionist right, independent
republicans, radical monarchist sectors and anarchist militants. Whilst
a contingent of troops was being prepared for Flanders at Tancos, the
working classes unfurled their anti-war banners and came out onto the
streets to denounce the policy of using them as “cannon fodder,”
and to underline the class nature of the conflict. In an attempt to obtain
the greatest possible consensus and to maximise social peace, Evolutionists
and Democrats proposed the creation of a Ministry of Labour with clearly
defined functions: to look after the food provisions for the poor, to
deepen the charitable support provided to the more needy, and to guard
against strikes. The government social welfare institutions were to serve
as a buffer against difficulties, as well as set up a basic network of
protection under the supervision of the government.
António Maria Lisboa, a leading figure in the Democratic Party,
a mason and a member of the Carbonária, was called upon to coordinate
the new ministry. The Ministry of Labour therefore had a reputation as
one of the more left-wing sectors sectors of the government, a tradition
that was to be maintained in the future.1 Besides guaranteeing
the capacity of the Ministry to engage in dialogue with the militant radical
workers, by virtue of his links with the Carbonária, António
Maria Lisboa brought to the post the experience that he had previously
accumulated in the civil service, in his capacity as the interim director
of statistics and director general of the Post Office.
The economic and social crisis dictated priorities. The Ministry of Labour
rapidly became a benchmark organisation in the collection of information
about prices and mutual aid societies, supplanting the practices of social
assistance engaged in by the Directorate-General of Trade and Industry.
A new phase began to take shape in the contextualisation of the working
class. The use of statistics for prevention and control gave way to more
sophisticated techniques of planning, forecasting and calculation. The
aim was no longer to disseminate norms and check patterns, but instead
to allocate resources. “The work of the State is not to provide assistance,
but to take providence,” (Boletim da Previdência Social 1919:
376) said Andrade de Saraiva to his peers at the Ministry of Labour. The
legacy of sociological paternalism lost its utility in light of the new
challenges being placed before the “Modern State,” making it
responsible for managing the social question in a situation of crisis.
In the same way, local surveys ceased to be of interest, for what mattered
were national solutions.
In no other contemporary institution did there exist such close ties between
the task of collecting information and legislative responsibility. The
imbuing of knowledge into action presented new challenges to techniques
of analysis: calculation became an instrument of governance with short-term
[immediate?] effects. Reforms such as the compulsory social insurance
payments of 1919 sought to attack the structural causes of the precariousness
of the working classes, pledging the State to seeking to achieve joint
solutions. The change from conceptions of social assistance to conceptions
of social welfare brought with it major alterations in the object of study
and in statistical methods, and raised new mathematical problems.
A carefully combined response to social problems was only possible by
considering national figures. There had to be an idea of the mortality
rate and the average salary to be able to minimally forecast the mathematical
reserve of invalidity and old age pensions and the corresponding deduction
rates. The change in the language and objectives of social policies required
the transposition of statistics to another level of abstraction and synthesis.
The other side of the coin was that the monographic study lost its immediate
relevance. Increasing the knowledge of a community or a region was only
of interest in order to draw conclusions that covered a larger area. Government
activity was now conducted through summarised numbers and not through
private networks of social interaction, as had previously happened with
the Directorate-General of Trade and Industry. In this way, the community
ceased to be the real object of study, and became a miniaturised universe,
for what mattered was extracting data for normative calculation from limited
series of observations. New questions were therefore raised at the methodological
level: How to move from the particular to the general? What was the representativeness
of the cases considered? What was the relationship between the parts and
the whole? Under the scope of the Ministry of Labour’s reformist
policy, case studies gave rise to sampling studies.
With these techniques, a short cut was introduced in terms of the diversity
of records, and greater economy was introduced into statistical procedures
with a view to the calculation of summarised numbers. This need was felt
even more deeply when civil servants had to forecast the consequences
of the reforms and anticipate valid solutions for the whole country. Planning
and prospective calculation were used to steer the services towards low-cost
methodologies capable of revealing single numbers. Statistics were integrated
into the recursive circuit of the action and the consequences of the action:
decisions had to be justified; results of decisions had to be gauged.
The term “single numbers” is used to designate the statistical
indicators that summarise quantitative data into one single value by means
of a criterion of classification, a criterion for the aggregation of data
or a ratio between variables. This definition is explicitly comprehensive
and includes everything from arithmetical averages to more complex indicators
such as the estimates of a country’s Gross Domestic Product. The
underlying methodology of calculation is here so important because of
the social use that is given to these indicators. What characterises single
numbers is precisely the fact that the values can be highlighted from
amongst the concrete mathematical operations that gave rise to them and
can be used as “things” that have their own intrinsic value,
which circulate and create areas of objectivity. The initiative shown
by State institutions in creating single numbers therefore ends up having
collateral repercussions throughout society, since the strict aim of ensuring
the governability of a given sector is rapidly overtaken by decentralised
processes for the appropriation of information. These processes reinvent
the function of indicators, as these are applied in different areas from
those originally envisaged. Once they have been made public, single numbers
begin to structure social interactions, for they make it possible to anticipate
information about the actions of others.2 The publication of
a consumer price index, for example, by reducing the universe of possibilities
and concentrating attention on a given value, changes an individual’s
expectations not only in relation to himself, but also in relation to
the possible strategies of other agents, companies and the State.
The Introduction of Sampling Techniques
The question of the increase in the cost of living became one of the main
themes of the working-class movement in the period of the First Republic.
From 1913 onwards, the protests of class associations, and particularly
of those that were influenced by the socialist movement, became much more
aggressive. In Lisbon, a Trade Union Central Committee was formed with
the aim of making propaganda against the high cost of living and encouraging
the creation of local committees. Newspapers such as the Voz do Povo launched a campaign arguing that prices had doubled while salaries
remained stationary.
Until then, the price of bread had been considered the main measure of
the people’s standard of living. With the increase in national income
in the second half of the 19th century (a growth in the national product
at a rate of 0.6% per year), the elasticities of demand changed and the
range of food products was diversified. Rice, potatoes, beans, dried cod,
fresh fish, chouriço and bacon, butter, sugar, soap, coal
and oil began to represent a very significant share of the household budgets
of working-class families and began to be widely advertised at grocer’s
shops, which sought to attract customers with attractive prices (Costa
Junior 1917:195-199; Quintas 1988). In order to gain a more complete knowledge
of the situation of the working class, it was necessary to establish a
benchmark for the 20th century that was equivalent to that provided by
bread for the 18th and 19th centuries. It was not enough to know the price
of the different commodities, since it was not possible to draw any safe
conclusions from these: what was needed was a single number that represented
a synthesis of the evolution of the cost of living. The first author to
attempt to represent the aggregate change in prices was Albino Vieira
da Rocha, who resorted to the values of imported and exported goods, just
as these were set out in the Trade Balances, in order to produce a single
index based on different “proportions” of 38 commodities that
entered into commercial trade (1913) (Rocha 1913). Using this methodology,
it was confirmed that inflation had risen 20% since the beginning of the
century. However, the impact that prices of imported and exported goods
had on the shopping basket of household budgets remained to be explained:
the statistical measurement related to goods included in the trade balance
did not have sociological content.
With the disgraceful situation of the First World War, the problem of
provisions once again encouraged discussion of the social question of
the cost of living. The normal supply circuits experienced a serious crisis.
There were wholesalers who took advantage of the circumstances to hoard
products and in some cases it was even necessary to resort to the services
of the army bakehouse to ensure the supply of bread at reasonable prices.
The difficulties were exacerbated by the fall in national production,
and the shortage of energy products and imported raw materials, which
pushed prices upwards. This trend grew worse from 1916 onwards. At the
recently created Ministry of Labour, the Economic Defence Department took
on the task of combating speculation and the shortage of essential goods.
As early as 1917, information began to be collected about the prices of
commodities in the various districts of mainland Portugal. Influenced
by the developments of the English statistics published by the Board of
Trade and by the Australian survey, Expenditure on living in Australia, Aquino da Costa Júnior, the head of the Economic Defence Department
at the Ministry of Labour, set to work constructing the first weighted
cost of living index in Portugal. Transferred to the Ministry of Labour
from the Directorate-General of Trade and Industry, this engineer combined
his new position with his work as a mathematics lecturer at the Lisbon
Science Faculty, where he was the most qualified statistical analyst.
How did the workers spend their salaries? This was the first problem to
be investigated. Quite simply, the question was more complicated than
it seemed. Consumption depends on disposable income and consequently on
the worker’s income level. However, it also depends on the household
structure, the person’s stage in the life cycle, the traditions of
the region’s material culture and its eating habits. In contemporary
language, this complexity is captured by the multivariate analysis model,
saying that the household structure, region and income level are variables
that help to explain the behaviour of the dependent variable of consumption.
Aquino da Costa Júnior felt the need to make the relationship between
these components explicit, because he was not thinking of surveying all
the households in the country. Instead, he wished to gather a significant
sample of the working-class population. Now, if there were no control
of sampling, there would be a danger that the conclusions might be distorted:
just think, for example, what would happen if the data collected were
to over-represent the proportion of families at advanced stages of the
life cycle and if their children, by contributing to the household budget,
were to push disposable income and consumption up to values above the
mean for the population: “in order for the budgets of the working
classes to be properly appreciated, we must take into account the relationship
existing between their income and the number of children who work and
do not work, without which apparently unreasonable conclusions might be
drawn”(Costa Junior 1917:108).
Although the idea of delineating smaller sectors for observation was not
new, discussing the social and demographic composition of a sample was
an important scientific step in Portuguese statistics3. Thanks
to this methodology, the doors were opened to low-cost data collection
and selection processes, replacing interminable counts through laboratory
modelling and through the mathematical analysis of the relationship between
the estimates of the sample and the parameters of the population as a
whole. Unfortunately, the initiative did not enjoy any continuity and
the recourse to sampling procedures remained relatively unaltered in until
the 1940s.
Aquino da Costa Júnior began by sending 7500 questionnaires to
350 of the country’s class associations. In the accompanying circular
letter, he considered the fact that science was the best possible ally
of the working class, a view that clearly revealed his positive belief
in the role of knowledge in transforming society: “Social science
abroad has taken its researches to the point of determining man’s
economic value, establishing the equation between what his sustenance
requires and what his work produces. This remarkable work of economic
speculation, which has benefited from the help of the class associations,
is responsible for most of the conquests achieved by the working classes
in their claims, based on a greater equity in the relationship between
capital and labour” (Costa Junior 1917:103).
Only 756 answers were received, a part of them being incorrectly filled
in, and a new request had to be made, this time being issued through the
local administrators. When it finally proved possible to amass a reasonable
volume of surveys, he moved on to the next phase. The methodology presented
by Costa Júnior was based on intuitive elements, without his putting
forward any theoretical arguments to support them. The lack of any more
profound justifications was probably due to the fact that the author followed
in the footsteps of the mega-survey undertaken by the Board of Trade in
1906, which represented the first survey of household budgets amongst
the working classes, simultaneously undertaken by various European nations.
The consultation of this source of authority gave scientific credibility
and legitimacy to the comparison of results in international statistics,
curtailing the discussion of sampling techniques. The nub of the argument
was centred on one single feature: showing that there were no spurious
elements and that all social factors that might influence the results
were subject to prior control.
A set of cross tables shows the distribution of the frequencies of household
types by income classes, the number of children by income classes, and
average income by region. Checking the reliability of these figures as
a whole consists of showing that, if we divide the answers to the questionnaire
into sub-samples, each of which is structured according to mutually exclusive
criteria, we will obtain new distributions that are reasonably similar
amongst themselves. In other words, the distribution of income classes
does not significantly change when we consider families with fewer than
4 persons and families with 4 or more persons (Graph 1). It can therefore
be deduced that this factor does not have any spurious influence on the
results of household consumption.
An intuitive methodology was followed, without any mathematical confirmation
of the conclusions and without any explicit formulation of the statistical
hypotheses. However, even at this intuitive level, there are two ways
of looking at things:
One is to consider the fundamental element of distinction to be the mean
of the distributions. Not only is the mean an appropriate statistical
indicator for filtering the random variations of social facts and showing
their regularities, but the symmetrical nature of the (normal) distribution
means that the deviations in one direction or the other cancel themselves
out. On the other hand, in large aggregates, the concentration of frequencies
around average values has a profound epistemic meaning, for it reveals
that there are constant causes guaranteeing the stability of data. Conversely,
any instability or difference between mean values proves that the aggregates
are affected by different causes. Such a conceptualisation was the starting
point for the notion of the “average man” developed by the French
mathematician Jacques Quetelet (Hald 1998: 586-598). Now, as the two sub-samples
of the survey undertaken by the Ministry of Labour present a household
income distribution centred more or less on the same average values, decreasing
thereafter at the extreme values, it seems legitimate to conclude that
they are similar. The similarity of the more frequent values in both sub-samples
therefore functions as proof of the fact that there are no causes influencing
one sample without also influencing the other. Our eyes are directed towards
the fact that most people were situated in the income classes between
3$00 and 5$00 escudos, both in the sub-group of families with more than
4 members and in the sub-group of families with 4 members or fewer.
Graph 1
Classification of working-class families according to their average family
income
2.1. Families with fewer than 4 members 2.2. Families with 4 or more members
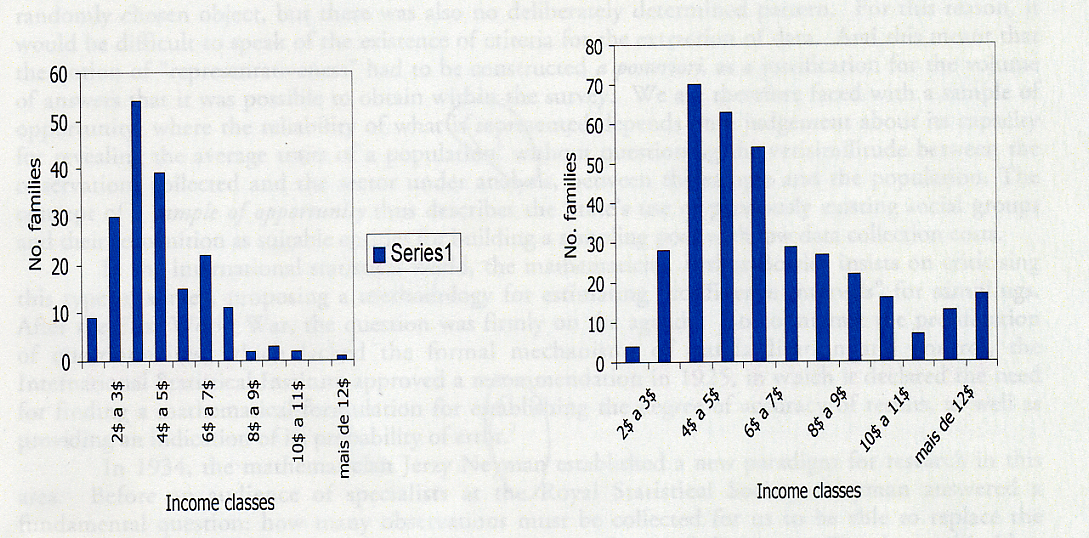
Sources:
(Costa Júnior 1917:103-109)
But there is another way of looking at the problem. The fundamental element
of distinction between the two sub-samples is not the mean but the variation
around the mean. The possibility of the distribution of the frequencies
not having a symmetrical shape and therefore of the mean not representing
the best estimate of the expected value is theoretically contemplated.
Other parameters are needed that are capable of showing the variation
at different moments of the distribution, both to the left and to the
right. In the actual case under analysis here, the prospect of change
directs our eyes towards the fact that the families “with 4 or more
persons” show a distribution with a pronounced tail to the right,
indicating that the larger households, probably those with children in
active employment, have higher incomes. From this, it can be inferred
that the two distributions are not exactly the same.
The succinct interpretation made by the Ministry of Labour did not suggest
this latter hypothesis, and it was satisfied with the conclusion that
there was a similarity in the distribution of incomes in different-sized
families.4 Underlying this was the idea that “representativeness”
is given by the concentration of sociological groups around a certain
mean. The sense of order, position and functional group is transmitted
through the concentration of the distributions at central values. Historically,
this view was closer to Quetelet’s Average Man theory, from the first
half of the 19th century, than to the English biometry movement, from
the end of the 19th century. This included the new discoveries of anthropometry
and mathematical biology made by Galton, Pearson, Weldon and other authors,
who centred their attention on the variability of individual cases and
on ideas of variance, correlation and regression.5 The priority
given to the study of groups, summarised by their mean, gave way to the
analysis of the distribution of individuals and their comparative difference.
The idea of using what is known about the population as a whole in order
to select small samples that represent the diversity of characteristics
of the whole group only began to be noted in the mid-1920s. A. Jensen,
the director of the Danish Department of Statistics, made a decisive contribution
towards testing this methodology and demonstrating its efficacy (Hald
1998: 290-291). Aquino da Costa Júnior’s view naturally did
not have anything to do with these techniques of intentional selection.
There were other concepts involved: the population of the sample was not
a randomly chosen object, but there was also no deliberately determined
pattern. For this reason, it would be difficult to speak of the existence
of criteria for the extraction of data. And this meant that the notion
of “representativeness” had to be constructed a posteriori,
as a justification for the volume of answers that it was possible to obtain
within the survey. We are therefore faced with a sample of opportunity,
where the reliability of what is represented depends on a judgement about
its capacity for revealing the average traits of a population6 without questioning the verisimilitude between the observations collected
and the sector under analysis, between the sample and the population.
The concept of a sample of opportunity thus describes the State’s
use of previously existing social groups and their recognition as suitable
entities for building a sampling pool with low data collection costs.
In the international statistical world, the mathematician Arthur Bowley
insists on criticising this type of survey, proposing a methodology for
estimating “confidence intervals” for samplings. After the First
World War, the question was firmly on the agenda. To counteract the proliferation
of questionnaires, which lacked the formal mechanisms of standardisation
and control, the International Statistical Institute approved a recommendation
in 1925, in which it declared the need for finding a mathematical formulation
for establishing the degree of accuracy of results, as well as providing
an indication of its probability of error.7
In 1934, the mathematician Jerzy Neyman established a new paradigm for
research in this area. Before an audience of specialists at the Royal
Statistical Society, Neyman answered a fundamental question: how many
observations must be collected for us to be able to replace the exhaustive
analysis of the whole by the investigation of one of the parts. Thanks
to this idea, statistical representativeness began to be gauged mathematically,
subordinating the importance of sociological representativeness. The very
concept of the confidence interval is also altered, ceasing to be a result
in order to become a flexible process, in which the researcher is called
upon to intervene. The statistician becomes a decider for it is his responsibility
to decide upon what would be the most suitable confidence interval: he
can equally well choose an interval of 99.5% or one of 95%. The greater
the level of confidence, the greater is the possibility of the real value
of the parameter remaining within the intervals estimated by the sample.8 This contribution provides theoretical support for the adoption of random
sampling techniques, freeing administrative techniques from prejudices
against the uncertainty of results in random choices.
In the survey undertaken by the Ministry of Labour in 1917 on the “Portuguese
proletariat,” the class associations and the ministry staff filtered
the answers twice over: the associations because they were intermediaries
in the choice of candidates; the ministry staff because it suppressed
answers that were considered invalid or fanciful. Although the historical
sources have not survived, it is legitimate to suspect that the less literate
workers, those who had greater difficulties in calculating their consumption
and those who were politically radical and refused to engage in any form
of collaboration with the State (it should be remembered that we were
at that time at the height of anarcho-syndicalist influence) did not contribute
to the final results of the sample. Such circumstances profoundly changed
the premises of random selection. If hypothetically we were to forget
such a reality and took the sampling as a genuinely random act, Neyman’s
theory would allow us to conclude that the 538 valid questionnaires (0.4%
of the industrial workers identified in the 1917 census) effectively guaranteed
a good estimate. Faced with the parameters of the distribution and basing
ourselves upon a confidence interval of 95%, it could even be said that
it would be enough to have access to roughly half of the answers collected
(292 questionnaires) in order to already be able to obtain satisfactory
results.9
Technical Legitimacy and Political Legitimacy of
the Price Index
The next step in the construction of the index of the cost of living consisted
in finding out how households managed their budgets. The quantities consumed
were calculated on the basis of 52 weeks (1 year) and began to constitute
what is now known in modern terms as the “consumer’s shopping
basket” (Table 2). From this reference, the index was calculated
by multiplying the average prices for a given year by the respective average
consumptions. Subsequently, the total expenditure of the shopping basket
was added up and a weighted average was obtained that fixed in one single
number the impact of the price changes on the life of families.
The publication of the first studies making use of the price index was
a source of great pride for the staff at the Ministry of Labour. The satisfaction
came from the fact that Portugal introduced this statistical innovation
before other European nations, more particularly before Spain and Germany.
Not everyone shared in this enthusiasm, however. The globalising expression
“cost of living index” gave an idea that did not correspond
to reality because many household expenses were not included in the “shopping
basket.” For technical reasons it was only possible for the Ministry
of Labour to investigate the prices of food and the odd products used
for hygiene and heating purposes.
Amongst the items omitted, clothing, linen and house rents were the most
problematical, for they represented a considerable portion of household
budgets (at least 25% according to the conclusions of the survey of workers’
consumption habits). In other circumstances, perhaps this technical lapse
would have gone unnoticed. In the agitated atmosphere of the First World
War, the deficient coverage of the index took on political overtones and
became a subject of debate. Due to the shortage of essential commodities,
the prices of food products and coal grew at a faster rate than all other
types of goods and services. Furthermore, they were imperfectly measured
by the official statistics, which did not capture the parallel evolution
of the black market. The wave of robberies at grocer’s shops and
small trading establishments in the spring of 1917 was the most visible
symptom of people’s impatience with the bottlenecks in the market
and the rising trend in prices. As the index only considered those essential
goods where the effects of inflation were most severely felt, the official
picture of the cost of living was higher than that which individuals experienced
in their day-to-day life. If we further add to this factor a high level
of social conflict, which continued until 1921 in the struggle for better
salaries, in a defence of the 8-hour working day and in the fight against
a reduction in work by the employers, then the ingredients were in place
for the index to become part of the social unrest. An exaggerated measurement
of the rise in the cost of living legitimised the workers’ claims
for an updating of their pay levels.
Table 2
Annual consumption of a working-class family (food, energy and hygiene)
according to the 1917 survey
| Product |
Annual
consumption of a 4-person family |
Product |
Annual
consumption of a 4-person family |
Bread
Portatoes
Beef
Lamb
Rice
Dried cod
Olive-oil
Coffee
Beans+chickpeas
Milk |
800
Kg
250 Kg
90 Kg
20 Kg
30 Kg
30 Kg
40 liters
12 kg
150 litres
180 litres
|
Eggs
Suggar
Lard
Chouriço
Bacon
Wine
Coke
Charcoal
Oil
Soap
|
40
dozen
50 Kg
10 Kg
12 Kg
12 Kg
400 litres
250 Kg
250 Kg
50 litres
100 Kg
|
Sources:
(Costa Júnior 1917:106)
Working class associations expressed their discontent by comparing the
increase in salaries with the increase in the prices of bread, dried cod,
meat and other foodstuffs, resorting to disaggregated prices to draw their
own conclusions. Against such a line of reasoning, the employers were
unable to counteract with a valid argument; they could not invoke the
single numbers of the cost of living, nor even wave the flag of scientific
objectivity. The mathematics of the Ministry of Labour coincided with
the arithmetic of the workers’ associations. Faced with the adversity
of the numbers, all that was left was to lead this debate to those places
behind the scenes in which technical discussion was the order of the day,
and to criticise the lack of credibility of the cost of living index:
“Unfortunately, our offices where statistics are kept are not equipped
to formulate the necessary data for the appreciation of the nation’s
different forms of economic life (...) At this moment, the working classes
wish to be given impracticable rewards for their work, and the impossibility
of satisfying such demands cannot be opposed with sufficiently convincing
arguments, because of the lack of statistical data on which such opposition
would have to be based.” This text appears on the opening page of
the Commercial and Financial Bulletin (Boletim Comercial e Financeiro),
distributed free of charge in banking and financial circles. The writer
of the article concludes his argument by requesting the compilation of
a truly representative price index: “not only is it necessary to
deal with the problem of food, clothing and accommodation, but it is also
necessary, in addition to such essential needs, to pay attention to the
habits of social solidarity, the organisation of education and health,
aspects of a recreational nature and others” (Boletim Comercial e
Financeiro, 1921). Through an ironical twist of fate, Aquino da Costa
Júnior’s visionary statement of science as the ally of most
working-class “conquests” ends up being proven, although not
in the sense envisaged by the author.
Against the background of galloping inflation, strikes and demonstrations
for better salaries, and the snowball effect of the budget deficit, single
numbers began to have strategic significance in the perception of the
indicators of the economy and the State’s behaviour. In five, or
possibly six years, things had changed so rapidly that the economic agents
needed reference anchors in order to be able to understand what was happening.
Comparing data from 1913 with data from 1919 or 1920 became a common practice
in all reflections upon this matter: in this interval was to be found
the unknown measure of the war’s economically degenerative effects.
Not only in Portugal, but throughout Europe, “index number mania”
was invading the space of reflection, and the essayists came to use the
aggregate information of these indicators as a platform for developing
their ideas (Andrade 1925; Costa 1926; Valente undated).
This whole conjuncture gave a special impetus to the search for single
numbers that were capable of reducing ambiguities and uncertainties. The
cost of living index became highly relevant, for it was a tool that was
already available to be used in measuring phenomena and in comparing them
in order to establish a pattern. The trend towards extrapolation necessarily
implied that the social meaning be decontextualised: what had previously
been an instrument for helping the working class was transformed, by dint
of circumstances, into a macroeconomic indicator that could be generalised
and applied to the whole country. The cost of living of the working population
was therefore transformed into an abstract rate of inflation. The first
step was taken in 1922, when the Statistical Yearbook reproduced Aquino
da Costa Júnior’s work in order to make a comparative estimate
of the evolution of prices in that year. The aggregate indicators were
presented as prices for the country as a whole and no longer just as measurements
approximating the standard of living of the workers. In other words, the
social significance of the aggregation faded away (this social significance
was represented by the value of q in the calculation of pq, which describes
the sum total of the prices weighted in accordance with the quantities
consumed).
In 1929, the Monthly Statistical Bulletin (Boletim Mensal de Estatística)
issued by the National Statistical Institute continued with the initiative,
updating all the information of the Ministry of Labour and establishing
the prices of July 1914 as the 100 base of the index. During the period
of the New State (Estado Novo), this indicator became the official one.
The State formed by Salazar appropriated the republican initiative, stripping
it of its social ideas and converting it into a technical device. Such
a disembodiment of knowledge implies that the conclusions that were strictly
valid in terms of sampling were later extended to cover the whole population.
The first attempts made by the regime to modernise the coefficients for
the weighting of consumption were unsuccessful. In an attempt to solve
the problem, the National Statistical Institute ended up resorting to
the survey carried out by the Directorate-General of Health in 1937 in
order to obtain data about household budgets. Once the index had been
reformulated, the advances made in the coverage of expenditure were minimal
and there continued to be only 21 items estimated in the shopping basket.
The discourse was therefore prudent and cautious. To avoid falling into
the controversies experienced by the former Ministry of Labour, it was
stated that the country did not have a real cost of living index, but
rather a “weighted index number of the cost of food and some articles
of domestic consumption” (INE; 1940).
But not everything had to do with technical difficulties. Some products
escaped the nets used for the collection of information simply because
the informality of transactions did not allow for any standardisation
of characteristics or comparison of prices. The selling of fruit and vegetables
on farms, in the street, at temporary markets and stalls, based on the
value of each unit, the circumstances of the moment and the general appearance
of the customer, fell under this category. Obviously, where the economic
rules of trade allowed themselves to be imbued with other factors, the
analysis of prices was more complicated. In these first indexes, there
was clearly some difficulty in capturing the evolution of perishable seasonal
products such as vegetables and of those that appeared on an irregular
basis, such as fresh fish. The very size and scale of market relations
limited the possibilities of statistics.
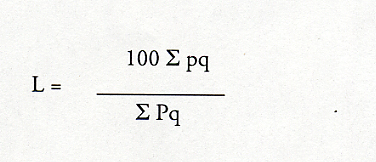
The main novelty in the updating of the index undertaken in 1938 was the
appearance at such an early stage of an official mathematical notation
of the formula proposed by the mathematician Laspeyres (1871).10 The price index of the Laspeyres type is still in use today in Portugal
and in the other countries of the European Union,11 and shows
the variation in the cost of a shopping basket of articles in the current
period (1), by comparison with the same shopping basket in the base period
(0):
According
to the economists Solow and Temin (Solow and Temin 1978:8), the Laspeyres
index has an effect similar to that of a man who, on the basis of today’s
information, goes to bed trying to imagine what tomorrow’s prices
will be like. It is easily understood that the great disadvantage of this
statistical indicator is that it does not accompany the trends of consumers
when they choose to buy new products whenever there are advantages in
replacing one good with another.
The statistics relating to inflation changed very radically after the
Second World War. The age of radio advertisements, restaurants, entertainments,
detergents, electricity, electrical household appliances and medicine
substantially altered the consumption routines of the urban classes. Changes
were now occurring at a much faster pace. From 1941 onwards, the Bank
of Portugal also began to publish a price index on a regular basis, and
in 1948 the National Statistical Institute finally presented a general
consumer price index.
A substantial improvement was immediately noted in the coverage of the
whole spectrum of household expenditure, particularly in the category
of services that had been undervalued until then. Furthermore, the index
now included those novelties that had caused such a stir in modern life:
football and other entertainments, electricity, restaurants and cafés,
personal hygiene, home furnishings and a fair sample of expenditure on
clothing and footwear (12 items for men and 19 items for women). The main
advance in this area, however, had to do with the inclusion of the price
series of house rents, whose absence from earlier statistics called into
question their reliability. Altogether, each month between 198 and 251
prices of goods and services were collected, five times more than previously,
and a fairly up-to-date number if we consider that the Consumer Price
Index for 1976 grouped together similar information (256 items excluding
rents). The new advances made in statistical credibility only occurred
during the 1980s, when the database increased to a total of 524 items
(1983 Index) and then to 577 items (1991 Index).
Despite the post-war improvements, the fact of the matter is that the
use of the sampling of the survey as the basis for the construction of
the coefficients for the weighting of the index was far from able to represent
the multiform reality of household expenditure in the different Portuguese
regions. The 56,215 individuals consulted in June 1948 were more a reflection
of the “population of the regime” than the population of the
country. The sampling criteria were drawn up from the corporate structure,
using “official” trade unions, based in Lisbon, as their channel
for the conveying of information. The overlapping between government and
State, together with the centralism of capital, was able to produce scientific
magic: a sample of 2.5% of the workers of each trade union in Lisbon ended
up being representative of the country’s socio-professional universe.
The reasons for the survey were grounded in the regime, serving simultaneously
as official procedure, a legitimising demonstration and a motivating narrative.
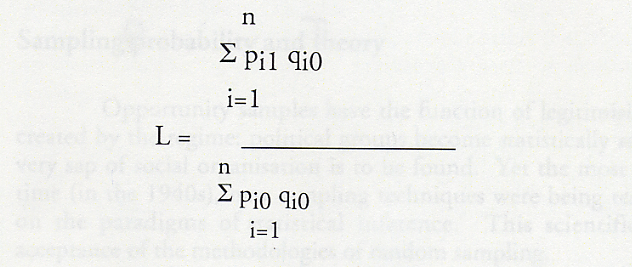
Sampling Probability and Theory
Opportunity samples have the function of legitimising the mechanisms of
representativeness created by the regime: political groups become statistically
relevant groups, for it is in them that the very sap of social organisation
is to be found. Yet the most important thing is to stress that, at that
time (in the 1940s), new sampling techniques were being tested in Portugal
for the first time, based on the paradigms of statistical inference. This
scientific advance was to lead to the general acceptance of the methodologies
of random sampling.
The new concepts were presented in a book published in 1938 by the scientist
who had most distinguished himself in Portugal in the experimentation
of mathematical statistics, the Coimbra University lecturer Euzébio
Tamagnini (Tamagnini 1938). From the point of view of practical applications,
it was in the field of agronomic studies that the first steps were taken.
At the Alandroal Dryland Crops Experimental Station and the Sacavém
National Agronomic Station, stratified samplings were developed, based
on the geometrical division of the cultivated land into “causalised
blocks ... with L strips, each with h possible sample units,
of which only K are included in the sample” (Oliveira 1948:
208). Ronald Fisher’s variance analysis, which had also come into
being at an experimental agronomic station in England, was the great theoretical
influence upon these experiments. It should be noted that the methodology
of artificially dividing the land into small experimental blocks transformed
the statistical observations into a random selection of the set of possible
measurements. The object of knowledge ceased to be the cultivated land
and was centred on the samples taken from this land. Consequently, instead
of having fixed parameters to describe the real distribution of the observations,
we were left with estimates, “mere statistics” based on insufficient
information, which might later be used to try and discover the parameters
of the real distribution. By making the mathematical calculation dependent
on the prior constitution of the series, the sampling became a logic for
science to represent the world. The methodology for the construction of
the observations was likened to a throw of the dice, and statistical facts
therefore acquired the theoretical position of probable facts. The premise
that there was a gap between the theoretical value of the parameters (mean,
standard deviation, regression, etc.) and their estimated value led to
the foundation of an epistemology that was to become known as statistical
inference.
The adoption of these methods in Portuguese agronomy was associated with
the activity of Manuel Zaluar Nunes at the Higher Agronomic Institute
in Lisbon. His works on samples of cereal and potato crops at Sacavém
and Alandroal were not in fact the only developments of the research.
In the 1940s, mathematical applications of sampling techniques to the
study of forests were also attempted to determine the volume of trees
in eucalyptus woods, controlling the errors to which sample units are
subject (Monteiro 1944:25-58), an activity that involved high costs in
information collection by direct measurement.
Around this time, the secondary school teacher and psychologist, Rui Carrington
da Costa, introduced an application of the significance tests (student
T-tests and Fisher’s z-Distribution) to check the forecast
of his students’ success at school, based on a small sample of 59
cases. As he said, it was a question of “assessing in terms of probability,
the degree of confidence that can be attributed to the calculations made...
establishing the limits of the discrepancy between the constants or parameters
of the sample and those corresponding to the population or sector”
(Costa, 1941).12
The contrast between the agronomic experimentation and the estimative
theory of school psychology, and the methodology of household budgets,
is enormous. The demographic and sociological concerns of the First Republic
resulted in surveys intended to confirm the political and administrative
structure of the New State, whose reliability was based on the law of
large numbers. Still missing, however, was an assessment of the degree
of confidence in the results (Bowley, Neyman) and the probability of obtaining
estimates in the samples that were different from the true mean of the
population (Fisher).
Seen from a comparative historical perspective, the adoption of sampling
methods, modelled by mathematicians, enjoyed a remarkable level of development
in the American administration during the period of the New Deal. In several
sectors of the Federal Government, namely in the Trade Department and
the Labour Department, but also at the National Cancer Institute, a generation
of young mathematicians replaced the routine statistics of the federal
government with Fisher and Neyman’s methodologies, proving that small
random samples were more accurate and rigorous than the exhaustive surveys
that had been undertaken until then (Salzburg 2001:172-180).
Scientific Culture and Political Culture: an Impossible
Compromise
The New State’s administrative opportunity statistics preferred to
demonstrate in an overwhelming fashion the regime’s power of persuasion,
gathering together tens of thousands of responses and encouraging the
collaboration of the corporate trade unions. In fact, the idea that individuals
can be drawn at random from a population and that they can be used to
form an experimentally valid group transcends the scientific question
to become a postulate that is politically incompatible with the basic
principles of organisation of the New State.
Salazar’s regime ideologically justified authoritarianism and restrictions
on freedom of expression with the argument that political representation
in Portuguese society gave a voice to the natural groups and spontaneous
forms of social structuring: the family, socio-professional organisations,
local communities. This corporate base made it possible to go beyond the
dilemma of the liberal model of the expression of individual interests,
as opposed to the socialist model of the representation of class interests.
Now, as the corporations were political realities and economic entities,
they also took on the role of administrative units for the purposes of
information collection (institutionally inserted in the data collection
circuits of the National Statistical Institute from 1944 onwards). The
regime established a representativeness prior to the statistical choices
made about groups and political and administrative classification. In
this way, however convincing the scientific arguments might be, there
could not be any great sensitivity to the idea of random sampling, for
this meant denying the representative logic of existing institutions and
the constitutional philosophy of representation, not to mention the risk
of obtaining results without any political control and opening the doors
to the sociological questioning of the variance in household incomes.
Establishing limits for the processes used for extracting information
from structures that were bound to the regime was the way of controlling
the outburst of randomness.
Notes
1 António Maria Lisboa remained Minister of Labour from March 1916
to April 1917. He was replaced by the horticulturist Lima Basto, the
former Mayor of Lisbon. With the revolution led by Major Sidónio
Pais in December 1917, Major José Feliciano Costa Júnior,
a member of the military Revolutionary Junta, occupied the post. The
Unionist and mason, Manuel Forbes de Bessa, in turn, replaced him in
March 1918.
2 This explanation in terms of decentralized information
effects is not incompatible with the explanation in terms of governmentalization
of politics advanced by Rose Nikolas (1991). Governing by numbers: figuring
out democracy. Accounting Organizations and society, 16 (7):
673-692.
3 Aquino da Costa Júnior was the first author to discuss
this problem when applied to economic and social areas. A first scientific
introduction to the theory of sampling probability was, however, provided
in a footnote by Luiz Feliciano Marrecas Ferreira, with the author making
use of the methodologies developed by the mathematicians Laplace and
Jacques Bernouilli. Marrecas Ferreira, Luiz Feliciano (1886). Estudo
sobre Montepios, Lisbon:Tipografia da Viúva Sousa Neves:
9.
4 The statistical test for the differences of the means gives
a result of –5.58, showing that there is a significant difference
in the mean of the two distributions, which allows us to conclude that
family size is effectively related to the variable of household disposable
income, contrary to the view expressed by the Ministry of Labour.
5 Astronomy and navigational sciences from the end of the
19th century, (Pedro José da Cunha, Wills de Araújo, Júlio
Milheiro and others), followed by criminal anthropology and the eugenics
movement from the 1920s, were the first scientific areas in Portugal
to introduce the analysis of the dispersion of distributions (standard
deviation and probable error). This representation corresponds in the
human sciences to an attitude of distrust in relation to the realistic
grouping of individuals into classes, justified by the sociological
sense of the normal distribution of the categories around a central
trend. The prospect of individual variation becomes important and calls
into question the aprioristic coherence of statistical categories, this
being one of the features of the criticism levelled at the biological
determinism of Lombroso (evident in the works of Roberto Frias, Basílio
Freire, José Joyce) and the distancing from the social elitism
of Darwinism (evident in the works of António Azevedo Castelo
Branco, Júlio de Matos, Magalhães Lemos). Madureira, Nuno
Luís, 2003. A estatística do corpo: antropologia física
e antropometria na alvorada do século XX, Etnográfica, VII(2):283-303.
6 According to Desrosières, the 1906 survey of the
Board of Trade, the benchmark for the Portuguese survey, as well as
others of a similar nature undertaken in Europe at the beginning of
the 20th century, were part of the mathematical theory of Quetelet’s
average man. On this subject, see Desrosières, Alain, (1998). The Politics of Large Numbers, Harvard: Harvard University Press
(English translation).
7 This recommendation by the International Statistical Institute
resulted from the insistence of A. Jensen and the Professor of Statistics
at the London School of Economics, A. Bowley, who at that time was the
scientist most evidently concerned with defining the conditions for
a probabilistic assessment of sampling error. Hald, Anders, A History
of Mathematical Statistics...., op. cit. (1998): 291-294.
8 “Note that to Neyman, the probability associated with
the confidence interval was not the probability that we are correct.
It was the frequency of correct statements that a statistician who uses
this method will make in the long run. It says nothing about how accurate
the current estimate is.” Salzburg, David, (2001).The Lady Tasting
Tea. How Statistics Revolutionized Science in the Twentieth Century,
New York:W.H. Freeman and Company, 123.
9 A group of 292 surveys would make it possible to obtain
a sample of working-class families with average incomes situated within
a 95% range of confidence, in the interval between 8 - Z a/2s÷n
and 8 + Z a/2 s÷n and receiving 5$69 and 5$09, respectively.
The average income of the survey of living conditions was 5$39 per family
per week.
10 In the Monthly Statistical Bulletin of the Directorate-General
for Statistics, INE, (1929) 3, a version had already been presented
of the Laspeyres index with an early notation that used a capital “P”
to indicate the current year’s prices and a small “p”
to refer to the prices of the base year:
11 France and the United Kingdom used variants of chain indexes
of the Laspeyres index to account for the permanent updating of consumer
behaviour.
The significance tests had previously been introduced by Eusébio
Tamagnini in the above-mentioned work published in 1938.
References
Andrade,
Anselmo de (1925). Política, Economia e Finanças, Coimbra: Coimbra Editora.
Boletim Comercial e Financeiro (1921) 85 (7).
Boletim da Previdência Social (1919). Acta nº 8, (8): 374-6.
Costa, F.G. Velhinho da (1926). A Situação Económica
e Financeira de Portugal, Lisbon:Imprensa Nacional.
Costa Júnior, J. Tomás Aquino da (1917). O custo de vida
em Portugal, Boletim da Previdência Social, (3):195-199.
Costa Júnior, J. Tomás Aquino da (1917). Inquérito
às condições da vida económica do operariado
português, Boletim da Previdência Social, (3):103-109.
Costa, Rui Carrington Simões da (1941). Possibilidades de
predição do aproveitamento escolar dos alunos do primeiro
ano dos liceus, Lisbon: Offprint from «Liceus de Portugal»-
Desrosières, Alain (1998). The Politics of Large Numbers,
Harvard:Harvard University Press (English translation).
Hald, Anders (1998). A History of Mathematical Statistics from 1750
to 1930, New York:John Willey & Sons.
I.N.E. (1929). Boletim Mensal de Estatística, 3.
I.N.E. (1940). Índice ponderado do custo de alimentação
e de alguns artigos do consumo doméstico na cidade de Lisboa.
Memória Descritiva, Lisbon:Imprensa Nacional.
Madureira, Nuno Luís (2003). A estatística do corpo: antropologia
física e antropometria na alvorada do século XX, Etnográfica, VII(2):283-303.
Marrecas Ferreira, Luiz Feliciano (1886). Estudo sobre Montepios,
Lisbon:Tipografia da Viúva Sousa Neves.
Monteiro, J., (1944). Estudos dendrométricos. Um caso concreto
de avaliação de volume de arvoredo, Revista de Agronomia,
(32): 25-58.
Oliveira, Augusto J. de (1948). Importância da amostragem na
experimentação agrícola, Offprint from Agronomia
Lusitana, X ( II): 208.
Quintas, Maria da Conceição (1988). Setúbal.
Economia, Sociedade e cultura operária, Lisboa: Livros Horizonte.
Rocha, Albino Vieira da (1913). Situação Económica
de Portugal. A alta dos preços, Coimbra: França &
Arménio.
Rose Nikolas (1991). Governing by numbers: figuring out democracy. Accounting
Organizations and society, 16 (7): 673-692.
Salzburg, David, (2001).The Lady Tasting Tea. How Statistics Revolutionized
Science in the Twentieth Century, New York:W.H. Freeman and Company.
Solow, Robert M., Temin, Peter (1978). The inputs for growth, in Peter
Matias and M.M. Postan, The Cambridge Economic History of Europe, Cambridge:Cambridge University Press, Vol. 7.
Tamagnini, Eusébio (1938). A heterogeneidade da variação.
Análise da variância, Coimbra:Tipografia Atlântida.
Valente, Guilherme, (undated). Problemas de Estatística e
Economia Política; Author Edition.
Copyright
2004, ISSN 1645-6432
e-JPH, Vol.1, number 2, Winter 2003
|