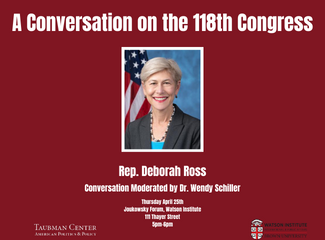
Table 15:
Lead Poisoning in Children Entering Kindergarten in the Fall of 1998


Number Tested
for lead poisoning

#Screened Positive

#Screened Positive

% Children


Children Entering
Kindergarten
Fall 1997
%Children

City/Town

15-24 ug/dL

>=25 ug/dL

>=15 ug/dL


>=15 ug/dL

Barrington

248

8

1

3.6%


2.8%

Bristol

296

14

1

5.1%


6.8%

Burrillville

190

9

1

5.3%


12.6%

Central Falls

479

59

33

19.2%


24.8%

Charlestown

118

5

1

5.1%


9.7%

Coventry

304

4

3

2.3%


8.2%

Cranston

894

41

8

5.5%


9.3%

Cumberland

330

12

1

3.9%


7.8%

East Greenwich

116

3

1

3.4%


2.7%

East Providence

648

36

10

7.1%


6.1%

Exeter

96

1

0

1.0%


7.1%

Foster

50

1

1

4.0%


4.3%

Glocester

109

1

0

0.9%


12.8%

Hopkinton

66

2

0

3.0%


12.3%

Jamestown

68

5

2

10.3%


10.8%

Johnston

286

12

3

5.2%


5.8%

Lincoln

236

9

2

4.7%


6.5%

Little Compton

22

0

0

0.0%


6.7%

Middletown

203

10

0

4.9%


5.0%

Narragansett

201

7

4

5.5%


8.8%

Newport

407

30

9

9.6%


12.1%

New Shoreham

14

2

0

14.3%


33.3%

North Kingstown

371

11

3

3.8%


6.1%

North Providence

372

16

2

4.8%


5.1%

North Smithfield

101

1

0

1.0%


6.6%

Pawtucket

1,262

88

36

9.8%


14.8%

Portsmouth

200

3

0

1.5%


4.2%

Providence

3,791

513

219

19.3%


21.0%

Richmond

103

5

1

5.8%


12.5%

Scituate

137

5

0

3.6%


11.0%

Smithfield

169

3

1

2.4%


4.9%

South Kingstown

406

18

9

6.7%


9.0%

Tiverton

171

2

1

1.8%


2.3%

Warren

170

14

2

9.4%


7.7%

Warwick

818

22

6

3.4%


6.8%

Westerly

153

17

4

13.7%


13.4%

West Greenwich

64

0

2

3.1%


5.9%

West Warwick

392

21

17

9.7%


9.1%

Woonsocket

884

64

15

8.9%


14.3%

Unknown Residence

151

16

20

23.8%


11.2%

Core Cities

6,823

754

312

15.6%


18.8%

Remainder of State

8,122

320

87

5.0%


7.5%

Rhode Island

14,945

1,074

399

9.9%


12.9%

 Rhode Island Department of Health, Division of Family Health, Childhood Lead Database, November, 1996. Core cities are Providence, Pawtucket, Woonsocket, Newport and Central Falls.

Data for the 1998 kindergarten class reflect the number of RI children screened positive for lead poisoning as of November 30, 1996. These data are for children eligible to enter school in the Fall of 1998 (i.e. born between 9/1/92 and 8/31/93). Due to Rhode Island law requiring universal lead screening for children under six, lead screening results for close to 100% of Rhode Island children in the specified age groups are included in this indicator.

The denominator is the number of children entering school in the fall of 1998 who were screened for lead poisoning.

Last Update: 5/8/97 by JDC