Lab VT 2010:
Hyperventilation, tidal volume, and CO2
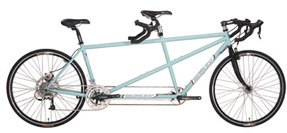
(While we continue the repair of the the tandem bike, you
will work with the gas and flow sensors as part of the VT setup.)
Although we might imagine that after vigorous exercise an athlete would hyperventilate
to take in oxygen, consider the definition below:
"Hyperventilation is the breathing response kicked
off by an acute panic attack or anxiety attack. Hyperventilation causes the
amount of carbon dioxide (CO2) in the blood to drop too low. Hyperventilation:
Overbreathing. This can cause dizziness, lightheadedness, weakness, shortness
of breath, a sense of unsteadiness, muscle spasms in the hands and feet, and
tingling around the mouth and fingertips." respiratory-lung.health-cares.net/hyperventilation.php
Can you find a better definition? And what's
the difference between breathe and breath?!
In 097 on the middle table see the following:
1. Clean green mouthpiece with filter and optional nose clip
2. Vapor trap in Erlenmeyer flask
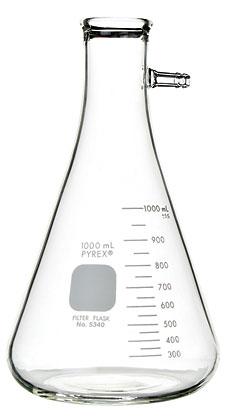 www.humboldtmfg.com
3. Omega flow meter model FMA1845, connected by D-9 sockets
to 12v power supply
4. One-way valves for excess flow release
5. Infrared Industries IR-208 CO2 / O2 meter, with analog output from back (C1
is CO2), and built in filter, pump, and flow control.
6. Connections from flowmeter and CO2 monitor to LabVIEW green 68-screw terminal
card:
As set up, on analog-in channels,
ACh 5--CO2
ACh 6--O2
ACh 7--flow meter 0-5v analog
The Omega flow meter LCD display reads full scale 1000L/minute,
and the same for its analog 5v output. Thus a reading of 100mV would mean 1000L/m*(100mV/5000mV)=
500L/m = 8L/sec. Measure the diameter of the passage in the flowmeter, so you
can have LabVIEW calculate volume (cm^2) of exhale on each breath.
Do not turn off the CO2 meter or the flow meter...they
take considerable time to reinitialize...
Create a LabVIEW VI that reads CO2, O2, and flow on each
breath. Arrange that with single point reads you have a virtual chart that collects
data of the three responses, for up to 5 minutes, and showing 10 seconds at
a time. Have your VI indicate the tidal volume after each breath.
1. Verify that running room air through the CO2 monitor
results in 0.00% CO2. What is the concentration of CO2 in the atmosphere at
sea level, to more decimal places?
2. With inlet and outlet of flowmeter disconnected, see
what the flowmeter reads... it should be close to 0000. An Agilent 34401 DMM
set to DC volts reads the analog out of the flowmeter: what is its zero-flow
reading, in mV?
3. Seat yourself in the green chair in front of the IR-208
meter. Take a breath and hold it for 10 seconds. Start your VI running simultaneously
with blowing the breath into the mouthpiece; your display should should you
the "impulse response" of the CO2 monitor, including the transport
delay for coming off 00.00% setting. What is the maximum CO2 from one breath
passing through the system? Using LabVIEW, integrate the flow waveform of the
breath to calculate tidal volume of one breath. What happened to O2 percent
as the CO2 increased? If you have time, do a second trial
after you set the 208 flowmeter to 2.5 instead of the standard 5.0. How much
more transport delay is there?
4. Breathe shallow slow relaxed breaths (inhaling through
your nose) into the mouthpiece and see how high the CO2 rises. Once it gets
above 3%, begin to produce "pseudo-hyperventilation" by breathing
faster and with more force. Keep up the hyperventilation for a minute. Return
to normal breathing to see how long it takes for CO2 to again exceed 3%. Stop
if you feel faint.
Show the results of your trial. What is the correlation
between tidal volume and CO2 level? Between CO2 and O2 percentages?
Team FTQ: What can you find out from Bio80 notes or from
the Internet about the normal range of exhaled CO2 percent in adult humans?
Is that the percentage an anesthesiologist keeps a paralyzed patient at? What
is the percentage of oxygen in the atmosphere at 4000m = 12000 ft elevation,
compared to sea level?
-------------------------------------
--------------------------
acchive NOTES on Velocity-Tension
"At a soirée of the Royal Society conducted by Hill in 1952 two
subjects mounted a specially built tandem stationary bicycle. While one subject
pedaled the other subject resisted him through directly coupled pedals. At a
speed of 35 revolutions per minute, the subject pedaling forwards used 3.7 times
as much oxygen as the one pedaling backwards. It was demonstrated that a small
woman, pedaling backwards, could rapidly exhaust a large man pedaling forwards
against her resistance. Since oxygen consumption and heat production are closely
tied, the muscles of the woman were presumably generating far less heat, even
though the coupling of the pedals guarantees that the forces and displacements
experienced by the woman's feet were the same as those for the man's."
Thomas A. McMahon, from chapter 2 of Muscles, Reflexes and Locomotion, Princeton
Univ Press (1984).
Background:
The lecture notes tell you about Hill's equation for muscle
velocity-tension
with the figure below from McMahon's Muscles Reflexes and Locomotion
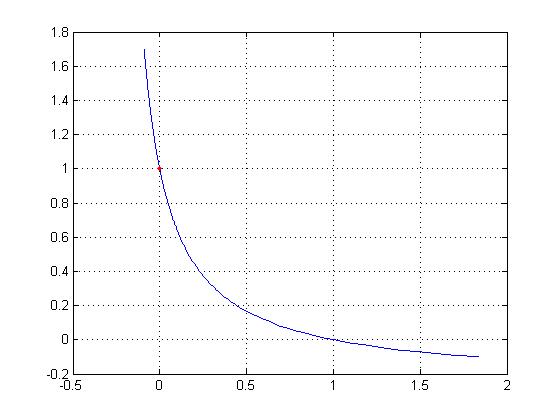
note the greater tension/fiber for negative velocity. The graph has been normalized
where we use  in the Matlab code described below, and you have control of constant k.
Note that α and β have the units of tension and velocity, respectively.
Muscle details:
1. Recruitment. To increase
tension (or velocity of contraction) muscle fibers are recruited, from the weakest
cells with the most endurance up to the strongest fibers, which are most easily
fatigued. Yes is it true that individual fibers can be stimulated at increasing
rates by their motoneuron axons, up to tetanus tension, but once one fiber is
pulling to the max, another fiber is recruited as necessary.
2. Velocity-dependent tension. Hill's equation shows the hyperbolic relationship
between muscle velocity and muscle tension. Note that when an active muscle is pulled
by an external load in the opposite direction of its intended contraction the muscle
is "doing a negative" (as weightlifters say) and its velocity is less
than zero. The tension per fiber is much greater in muscle fibers doing negatives
than tension in a fiber going the same speed in the opposite (positive) direction.
3. Muscle fatigue. The
FG (fast glycolytic) muscle fibers (white meat) that can exert the greatest
maximum tension are the most easily fatigued.