Lab
9: Bimanual Knob Rotation Frequency and Hypothesis Testing with EXCEL
Background: Your
goal here is to use LabVIEW's frequency analysis feature to determine the maximum
rate you can rotate back and forth potentiometer knobs on a chassis box. In
the process, you will acquire two waveforms simultaneously.
With the data you and others
collect you will test the hypothesis that in-phase bimanual control of the knobs
is faster than alternate phase rotation (terms defined below, and see chpt 7
of Tom McMahon's Muscles, Reflexes and Locomotion).
Scan selected chapters (7,
10) from Loftus & Loftus, Essence of Statistics. Read lecture notes
on hypothesis testing.
Requirements:
Inspect one of the
open chassis cases, with the two potentiometers inside, leading out to white
binding posts. Notice how a reference voltage can be connected to the chassis,
and how the reference goes to voltage dividers including the potentiometers.
(1) Power your chassis box
with 5-10 volts from the triple output power supply. Use your digital mulitmeter
to see the range of voltage outputs as you turn the potentiometer knobs.
You need to hook up the voltage
divider outputs to two analog channel screw terminals on the green DAQ board
connector block, so your signals can be read by your LabVIEW VI. Consider connecting
to analog channels 1 and 2.
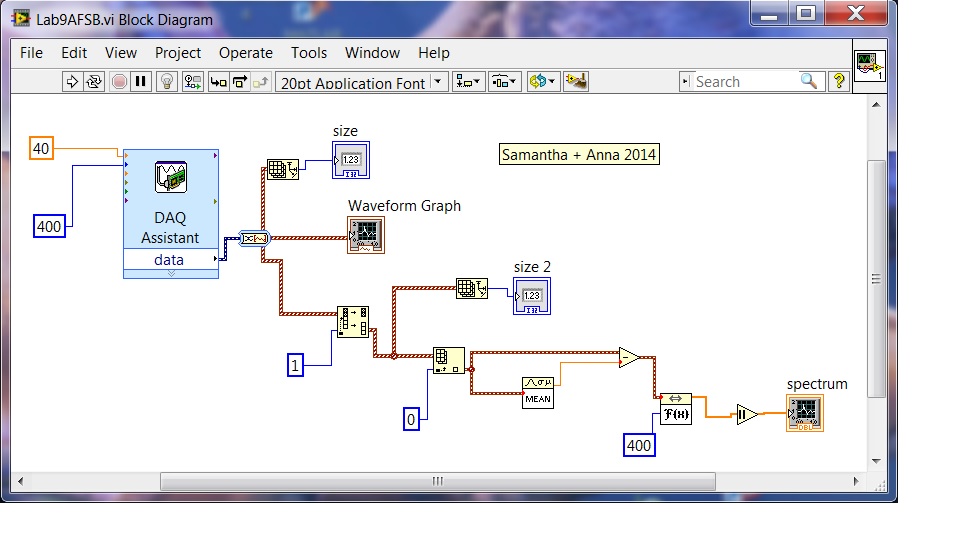
(2) Acquire knob-turning waveforms from the two potentiometer simultaneously
and display the function-of-time waveforms as two different colors on one graph
on your VI front panel.
Acquire the waveforms for
a duration long enough to insure 0.1Hz frequency resolution after FFT, and with
a high enough sample rate to insure that 20Hz can be observed without aliasing.
Arrange that the time and frequency axes of the waveforms are properly labeled.
More details
about what "knob rotation" means: The subject is required to keep
his or her thumb on knob during rotation. Also it is not allowed to wrap sticky
tape on the knob. We are expecting that knob rotation will involve movement
of the wrists and or fingers, not the shoulders only.
(3) Send ONE of the knob turning
waveforms through a spectrum analyzer...suggestion:
( Mathematics:Signal_Processing:Transforms:FFT )
for display as a third graph on your front panel. Arrange that the frequency
axis on the graph is properly label. Make sure that any DC in the signal is
subtracted away before going to the FFT icon (same one called for in Lab 6).
We will want
to see that you can read off frequency to the nearest 0.1 Hz. To improve readability,
make your frequency graph as wide as possible, and have tick marks every 0.1Hz,
and have "x" marks through the spectrum data points.
(4) Perform a series of experiments
with you and your lab partner (and at least 3 other subjects you can find...INCLUDE
results from JDD/DAB and a TA in your data base.) of alternate phase
and in-phase rotation of the knobs, and rotating one knob at a time with dominant
then non-dominant hand.
In designing your experiment,
motivate your subjects to go as fast as they can. Make sure the knob box doesn't
rattle around while the knobs are being turned. In room 095 we have clamps for
your use. Use vises to secure your box during subject testing. Instruct your
subjects to turn the knobs without going to the limits of their rotation. INCLUDE
results from JDD and a TA in your data base. At the end of the ALT-PHASE
test of each subject inspect the simultaneous time-base waveforms to make sure
the subject did NOT switch to IN PHASE timing to speed up. For subjects who
can rotate knobs faster than 5Hz ask whether they play violin or piano...
(5) Type your data as columns
into an EXCEL spreadsheet, to the nearest 0.1 Hertz. Inspect your data to see
if it is "reasonable". Compare for each subject
the IN PHASE(IP) speed and the non-dominant(ND) hand speed. Are any subjects
slower for ND than IP? How can that make sense, since the ND hand must have
been going at the speed of the IP result? Try it just rotating your wrists in
the air in front of you, going IN PHASE, the stopping the dominant hand. What
does the ND hand do at that point?
(5b) In Excel, use TTEST function
or go to Data Analysis under the Tools menu, and select the appropriate t-test.
Report on the significance of the differences of IN phase vs ALT phase, and
dominant vs non-dominant hand.
(5c) Also
test dominant and non-dominant vs IN-PHASE rotation. Do you see any significant
differences?
(6) Are any of your results
significant at the 5% level? 1% level? What's the difference between one-tail
and two tail testing? Here
is a website that helps interpret the EXCEL display of t-test results.
(7) What is the correlation
between the data for IN PHASE and ALT PHASE for your subjects? The correlation
between DOMINANT and NON-DOMINANT HAND? Use "Pearson" function in EXCEL.
FTQ: We will give in
class a URL on the EN123 website that will locate a one-question take-home quiz.
The quiz will involve understanding topics from lecture, including the binomial
distribution, Poisson distribution, normal distribution, t-test, and correlation.
Reading: The lectures notes on Hypothesis
Testing, and the selected parts of the Loftus and Loftus book, chpt 7-10..
You should use in the knob rotation VI the "Acquire Waveforms"
icon, which has special needs for conversion of its output to a form that can
be processed by Power Spectrum. See VI suggestion below:
Alternate vs in-phase: In-phase means that both hands are mirror images
of each other during rotation; the same muscles are being used in each arm for
IN-PHASE. Alternate-phase rotation means that both hands are rotating the knobs
CW or CCW at the same time for ALT-PHASE.
See Tom McMahon, Muscles, Reflexes and Locomotion, chpt 7.
Scoring: For the lab itself you can be signed off by
showing the data from your subjects and the significances of your results: 6
points. Getting the correct answer the first time on the Stat Quiz will get
you another 6 points. If you need a second chance at the Stat Quiz, you can
receive at most 4 quiz points.