Probability: definition:
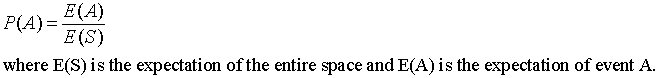
Expectation is average, or mean, in typical examples.
Statistical Analysis of Data, especially in the Service of Hypothesis Testing and Decision Making
update: Nov. 2002, 2004
¶ Probability, fuzzy sets, estimation, and decision-making
¶ Counting ordered combinations segues to binomial distribution
¶ Binomial distribution segues to the normal distribution
¶ hypothesis testing: the null hypothesis
¶ correlation
¶ Markov chain: conditional probabilities (coming soon)
Reading: Chapters 7-10 of Loftus & Loftus, Essence of Statistics, with emphasis on 7 & 10.
Example: Consider statistical analysis for hypothesis testing. Suppose you have an explanation--a hypothesis--for some observation of nature: Example (from visual physiology): that direction selective neurons recorded from the vertebrate retina require excitatory AND connections in their dendritic trees, with one input coming through a delay line from a neighboring photoreceptor. Suppose you design an experiment to test your hypothesis: record proximal signals from a dendritic bifurcation while controlling its two distal inputs. Two inputs are given uncorrelated noise of 50% duty cycle square waves, and the percentage of time OUT is HI is recorded. 25% of the time you expect the two input signals to be simultaneously HI, driving the proximal dendrite HI. You measure the actual % time the proximal dendrite is HI. To the extent it is near 25% your "alternative" hypothesis looks good. Can you do better? Yes. (1) Measure from many bifurcations. 100? (2) Keep track of stimulation and response: Is the output HI correlated with inputs being simultaneously HI? What about correlating current output with input from some msec ago?
Probability: the study of probability grew of an interest in understanding
various forms of gambling. Much progress was made in mid-17th-century France, during
a period when high-stakes gambling flourished in the and around the Royal Court.
Pascal (1623-62) made the most progress. See Chpt 1 of Physics With Illustrative
Examples from Biology and Medicine Vol 2, Statistical Physics, by Villars &
Benedek, A-W (1974).
Probability: definition:
Expectation is average, or mean, in typical examples.
Probability: Example: baseball: Suppose you've collected hitting statistics (probability of single, double, homerun, out, etc) on batters of team RS. You have also written a baseball simulator that uses a random number generator to decide what happens to each batter in each inning and keeps track of the runs scored for all probabilities above a threshold. For a given lineup against a given pitcher, you run the simulator 1000 times, and generate a table of percentages of runs/game that team RS scored. Let's say it's a table of probabilities for 9 entries, from 0 RPG to 8 RPG. You do a similar set of simulations for team NY lineup against a RS pitcher. What is the average score per game for team RS? What is the probability that team RS will defeat team NY? The probability that the game will go to extra innings?
ANS: Multiply runs/inning vectors with itself 9 times to generate the Runs/Game vector for each team. Multiply the two team's RPG vectors together (outer product) to form a 9 x 9 matrix of all probabilities of RPG clashes. The spreadsheet below shows in color what sections map out Tampa, Red Sox and Extra Inning probabilities.
link to spreadsheet showing the probability matrix for all combinations of RPG of the two teams
Counting: Permutations vs combinations
Combinations are arrangements without regard to order; in permutations, order
counts How many permutations of N things taken N at a time? N!. [For the first position
there are N possibilities, for the second, N-1, etc.] How many combinations
are there of N things taken r at a time? (say N>=r)
![]() .
How many combinations of 5 coin tosses result in exactly 2 heads? 10. Given that
p is the probability of heads and q the probability of tails, what is the probability
of seeing exactly 2 heads in 5 coin tosses? .
.
How many combinations of 5 coin tosses result in exactly 2 heads? 10. Given that
p is the probability of heads and q the probability of tails, what is the probability
of seeing exactly 2 heads in 5 coin tosses? . ![]() .
When r=2 and N=5 , and we assume p=q=0.5, then the answer is: 10/32 = 5/16.
.
When r=2 and N=5 , and we assume p=q=0.5, then the answer is: 10/32 = 5/16.
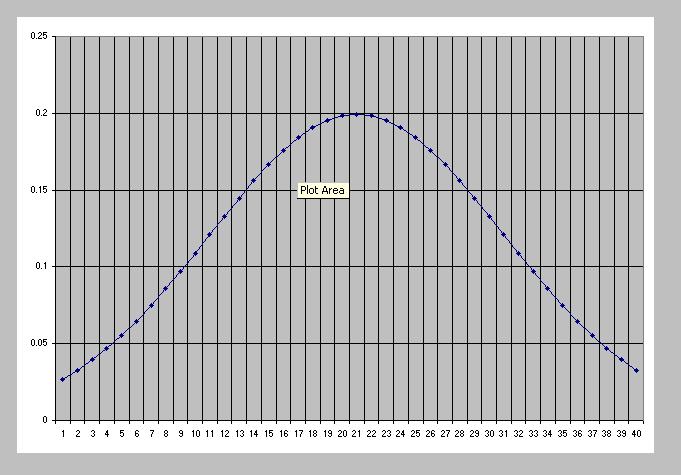
The binomial distribution:
The formula above, for the probability of exactly r out of N, describes the
binomial distribution. Example: What is the distribution of the number of heads
in a 10-coin flip? There could be anywhere from 0 to 10 heads up in such an event.
What are the number of combinations of 10 things r at a time, where r will be the
number of heads? Consider expansion of ![]() ,
the coefficients of the expansion will be the numbers of successes for each of the
powers of p, for 2^10 = 1024 trials. The sum of the coefficients will equal 1024.
And can be seen as the coefficients of Pascal's triangle. The standard deviation
of a binomial distribution is
,
the coefficients of the expansion will be the numbers of successes for each of the
powers of p, for 2^10 = 1024 trials. The sum of the coefficients will equal 1024.
And can be seen as the coefficients of Pascal's triangle. The standard deviation
of a binomial distribution is ![]() .
.
Examples of
binomial distributions.
Another possible FTQ: Suppose 10% of the population is left handed, (for people under the age of 50). In a nursing home you interview 201 residents in their 80's, and find that 12 are left-handed. What is the chance that 80 year olds are from the same distribution as the under 50-population?
Use EXCEL function BINOMDIST(success, trials, prob of success,
cumulative=1),
type =BINOMDIST(12, 201, 0.1, 1) in an EXCEL cell and find the answer, 3%.
Thus at the 5% level it would appear that lefties die young.
Election 2004: Suppose before the election you ask 9 of your friends who they will vote for, Bush or Kerry. 5 say B and 4 say K. None are undecided, and none named a 3-rd party candidate. In fact B 5 and K 4 is one of 10 possible outcomes, from B 0 to B 9. Using BINOMDIST with EXCEL you can calculate the probabilities of each of the 10 possibilities.
Say the null hypothesis is that will each candidate will
receive the same number of votes: that the probability of any of the 9 friends voting
for Bush is assumed to be 0.5, then what is the signifcance of 5/9 actually choosing
Bush?
The Poisson distribution:
Suppose p << q , implying rare events. A recast of the binomial expansion
results in a Poisson distribution. The probability of n events in time interval
Δ t is ![]() where lambda t is the average number of events in interval Δt.
where lambda t is the average number of events in interval Δt.
The arrival of raindrops on a roof tile per second, or the release of neurotransmitter vesicles at a synapse, within 100 msec of an action potential, can be described by Poisson statistics. The key number is many "Poisson experiments" is how many failures there are: how many instance of zero raindrops, or zero vesicles released? orzero hurricanes striking the USA during a season?
Katz, 1959, for Nobel Prize in 1970
-------------------------------------------------------------------------------------------
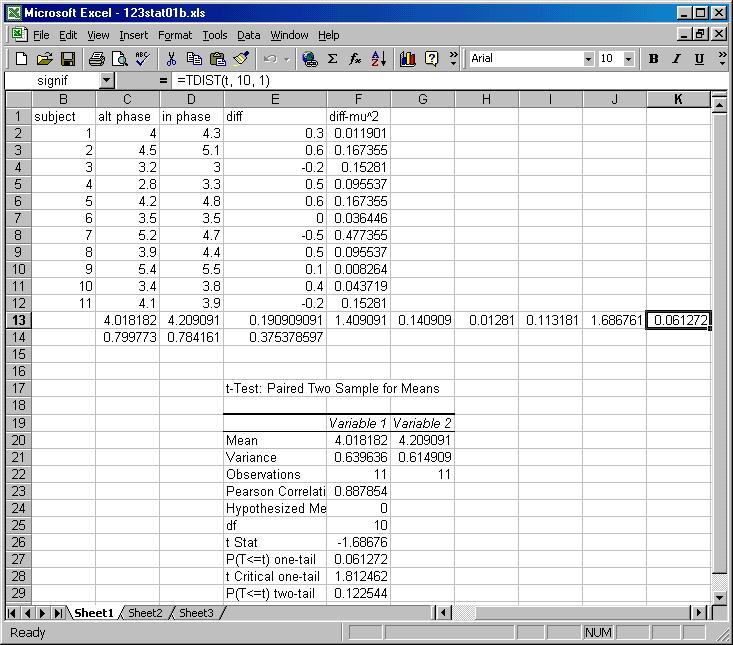
As part of the knob rotation lab, you'll learn to use EXCEL for statistical
analysis, particularly the t-test in Tools/Analysis. Also see normhist
function for calculating from the normal distribution.

Normalizing Data: Look at the exponent of e in the definition of
the normal distribution. L


Example 1 of FTQ for Lab 9:
Suppose the population of college students is tested on how many digits each can
remember. Say the average is 7 and the variance of the population is 4. Now say
a sample of 12 Brown students can remember a average of 8 digits. Is is significant
at the 5% level that Brown students are better at remembering digits than the average
college student?
Comparing two variants of a population: The example above investigates whether
an experimental group within a a population is significantly different. What about
comparing two experimental groups of a known population with each other? You will
form a z term of
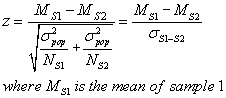
Where S1 and S2 are the two samples to be compared.
Suppose it's known that the average area of maple leaves on the ground in October is 25 cm-sq, with a standard deviation of 5 cm-sq. A sample of 22 Japanese maple leaves has an average area of 32 cm-sq. Someone else comes in with a sample of 18 bigleaf maple leaves with an average area of 38 cm-sq. Is it significant that bigleaf maple leaves are larger than Japanese maple leaves?
Seen in every news article about political polling: margin of error: 3% margin of error: if you asked a poll question 100 times, 95 of those times the percentage of people giving a particular answer would be within ±3 percent of those who gave that same answer to the poll question.
To find a situation where 1000 people would satisfy the margin
of error above, assume the population of the state is 1,000,000 and that the probability
of choosing the candidate is 0.5. then
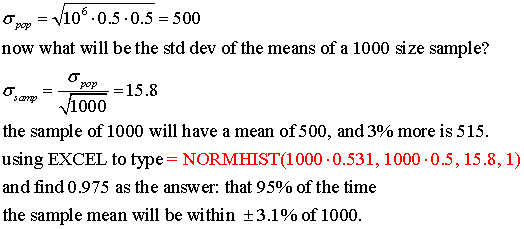
See websites for calculator, definition, etc:
http://www.americanresearchgroup.com/moe.html
which calculates the same answer as above, for population and sample size.
http://whyfiles.org/009poll/math_primer.html
If population
statistics are not available:
Now
suppose, like in the case of the knob rotation experiment, that population statistics
are not known.
What can be done with s.t.d. of the samples?
In
their chpt 9 Loftus & Loftus say that with sample variance S^2 then
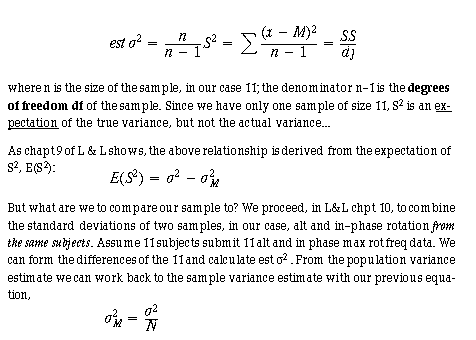
Chapter 10 of L&L tells you about the need for t-tables when the underlying population statistics are not known, as is the case for our knob rotation experiment. You can estimate population statistics as given by the examples in chpt 10, or go directly to the EXCEL t-test analysis tool. What you need to know about the EXCEL tool is how to interpret the results it will present. Study what it means to be a one-tailed or two-tailed test, and what the calculated probabilities mean in terms of hypothesis testing.
(2004) What is t? From
Adler & Roessler, Intro to Prob & Stat 5th Ed, Freeman (1972), p.
156,
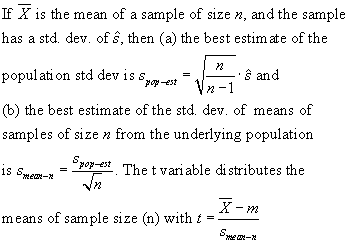
Where m is the "null hypothesis mean" of the population.
The distribution of t depends on n and is tabulated in tables or
kept as a calculation in EXCEL of TDIST(t, degrees of freedom, tails)
expressed as a cumulative probability.
For example, suppose
a sample of 9 femurs from lemurs show their mean length to be 20 cm, And that the
variance of the length is 9 cm. What is the probability that the lemur femurs are
NOT from a population of mean length 24 cm?
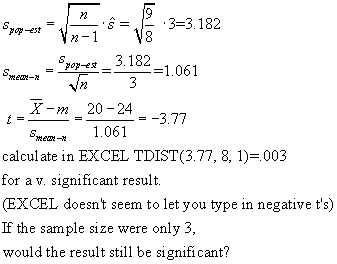
Comparing two samples of different size, without knowing
population stats: (like the knob rotation problem) In this case the degrees
of freedom is n1 + n2 - 2, where n1 is the size of sample 1 and n2 is the size
of sample 2. The variance of the sample means for this problem is the sum of
the two sample variances of the two means. Then term m in the t formula above
is normally set to 0, so

where the variances are of the sample means.


Correlation.
In the knob rotation lab we record from the same subject the
max rotation frequency for the dominant and the non-dominant hands. Results vary
from subject to subject. Are the results correlated? (is the Dom/ND ratio always
the same for each subject?)
Definition of correlation: Assume we have a set of paired data { x, y }
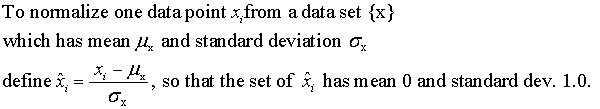
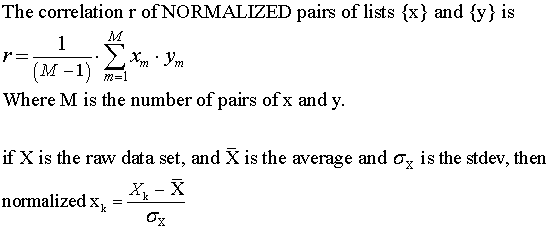
The correlation coefficient will be between -1 and +1.
In EXCEL you can find the operation Pearson: from the EXCEL Help menu we learn
that it
Returns the Pearson product moment correlation coefficient,
r, a dimensionless index that ranges from -1.0 to 1.0 inclusive and reflects the
extent of a linear relationship between two data sets.
Syntax
PEARSON(array1,array2)
Array1 is a set of independent values.
Array2 is a set of dependent values.
A B
9 10
7 6
5 1
3 5
1 3
Formula Description (Result)
=PEARSON(A2:A6,B2:B6)
Pearson product moment correlation coefficient for the data sets above (0.699379)
Glossary: