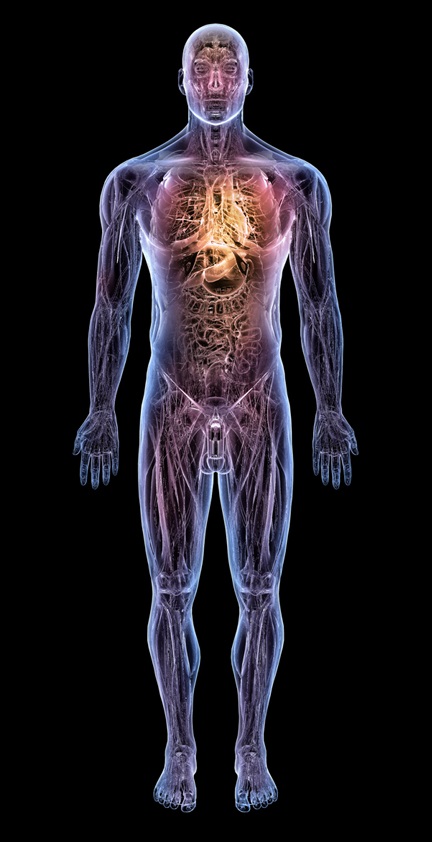
Visualization techniques are becoming increasingly common in both detecting diseases and planning the treatment. Doctors can recreate organs and structures in the body to spot abnormalities such as tumours or fractures.
Hover over the green dots to learn more about how specific images help diagnose and treat diseases.


Enlarged thyroid: Swelling of the thyroid can indicate underlying diseases from iodine deficiency to both benign and cancerous tumours. By comparing the thyroid volume from CT scans, showing its physical size, with the volume from nuclear scans, showing its active size, doctors have a better indication of whether the enlargement requires treatment or not.


Left heart ventricle: The left image shows the left ventricle just before a heart beat, and the right just after. By measuring the difference in volume between the two scans, doctors can calculate how much blood the heart is pumping on each beat. Abnormally low volumes of blood can indicate problems in the heart valves or a weakening of the heart muscles, which can lead to heart failures.

Fractured pelvis: Doctors can see the full extent of the two fractures from the 3D rendering of the pelvis. By comparing the two sides, they have a patient specific model of how the pelvis should look, leading to more effective treatments.


Weakening of blood vessel walls: To strengthen weak blood vessel walls, doctors insert a mesh around the vessel. 3D visualizations of the blood vessel before, left, and after, right, shows that the blood vessel has returned to its normal shape and the treatment was effective.

Liver with tumors highlighted in green: The ratio of tumor tissue to liver tissue informs doctors how much of the liver would be left if they cut the tumour out so they can plan treatments more effectively. The ratio answers important questions like will the patient have enough liver left to live on if they cut out the tumour?


Premature bone fusion in skull: The bones of an infant's skull are typically separated by flexible connections, sutures, so the skull expands as the brain grows. In some infants, the bones are prematurely fused together so there is not enough room for the brain, causing irregularly shaped heads and mental impairment. This condition can easily be fixed, but the earlier it is detected, the more time there is for the infant's head to grow normally. In the two images above, the one on the right shows the sutures where the skull plates meet. The separation between plates that we expect to see in an infant's skull is not there.


Airway at inhalation on left and exhalation on right: Comparing scans at inhalation, left, with scans at exhalation, right, doctors can see how much the airway narrows on each breath. Too much narrowing can cause the airway to collapse and this visualization gives doctors a method to evaluate the risk of this happening. The top left image of the 3D view inside the airway shows the narrowing, while the other three 2D views show exactly where they're looking at inside a patient's body.

Kidneys with connected blood vessels: Kidney donation is often more dangerous for the donor than the recipient because it is connected a major artery, the aorta. Normally, there is one vessel connecting the kidney to the aorta, but it is not uncommon to find more. The image of the connections can help doctors determine if there are additional connections, and if one kidney would be easier to extract than the other.


Heart in 2D and 3D: On the 2D images, technicians have reformatted the orientation so the full artery shows up on one plane. This helps doctors diagnose potential problem areas like blockages or weakening of the vessel wall, see aorta. The 3D visualization is useful as a teaching tool to explain conditions to patients and students.


Kidney to bladder: Since vessels in the body don't lie on a flat plane, technicians need to process images to track the whole vessel on a 2D surface. The pictures above tracks the tube connecting the kidneys to the bladder, called the ureter. Technicians rearrange the 3D data of the body so the ureter shows up fully on a 2D image. For comparison, both images are from the same set of scans, but one is reformatted to show the left ureter while the other the right. On the right image, we can see the ureter on the right clearly, while we can only see a segment of the one on the left. On the left image, we can easily spot the ureter fading towards the bladder, indicating a blockage.
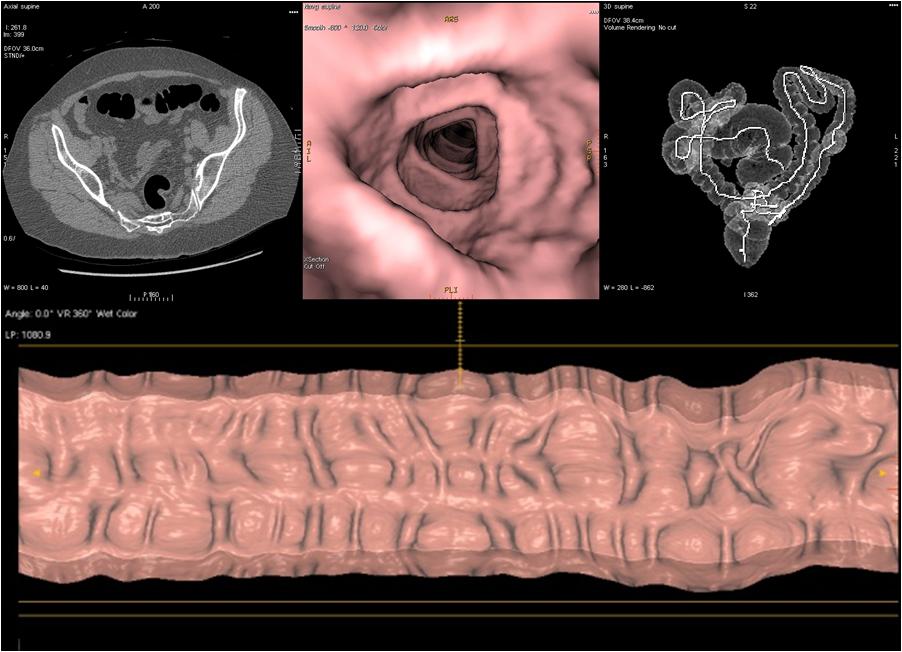
Virtual colonoscopy: Doctors can reconstruct the insides of the colon through scans to simulate colonoscopy but they can scan patients quickly and easily while patients are usually sedated for physical colonoscopies. The top center image shows the 3D reconstruction of a part of the colon while the images on either side of it show the location of this reconstruction in relationship to the rest of the body. On the bottom, technicians have unrolled the colon as if it's a flat surface. Abnormalities are easier to spot while scanning through 2D views than navigating in 3D.