Make animated molecules
by Andrew Peterson
In atomistic simulations, we often have trajectories, or sequences of images such as a reaction pathway along a minimum energy path, and its useful to be able to visualize these for print and presentation. As we all know, in presentations movies often fail to work, and I've found animated GIFs to work well. The approach to make these files is described below.
Make one test image
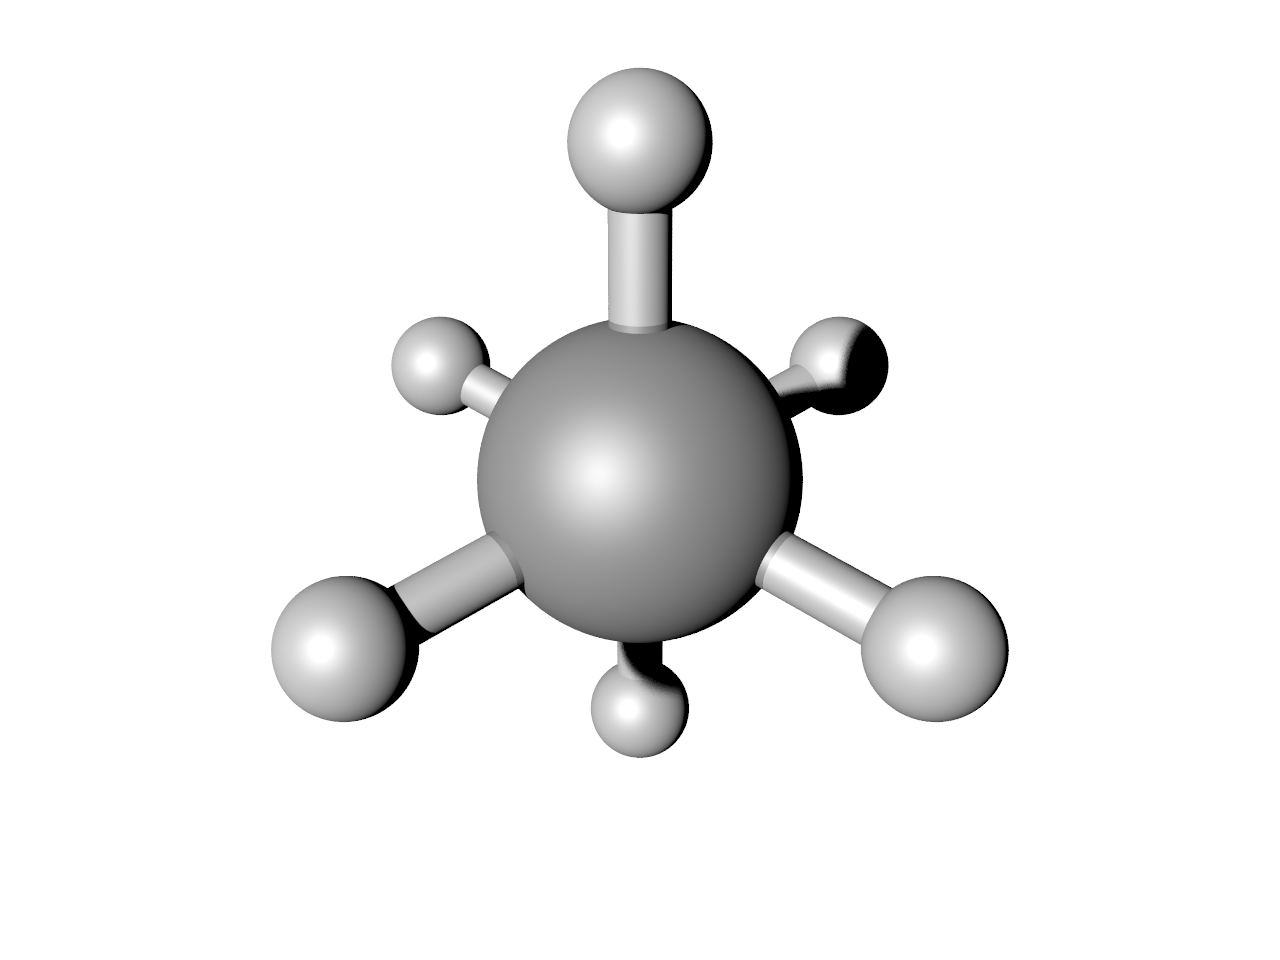
We start with a trajectory file that we want to use. We'll use an example of the calculated (with NEB) minimum energy pathway of rotating the methyl group in ethane. The file is located here. You could do this with ASE's POV module, but we found it a bit limited so wrote a more powerful one available in our pgroup repository. We can make a single image like this:
from ase import io
from pgroup.ase.io import POV

atoms = io.read('ethane.traj', index=0)

pov = POV(atoms,
          pixelwidth=2*640,
          radii=0.7,
          bondatoms=[(0,2), (0,3), (0,4), (1,5), (1,6), (1,7),],
          cameralocation=(0., 0., 6.),
         )
pov.write('ethane.pov')
This should result in an image like below. Note this requires a working installation of the open-source code POV-Ray. You can play with the keywords in POV (and there are many more you can find with help(POV)) to change how it looks.
Make a series of images
If we're satisfied with the single image, just automate this in a script for all images in our trajectory file.
from ase import io
from pgroup.ase.io import POV

def makeimage(index):
    atoms = traj[index]

    pov = POV(atoms,
              pixelwidth=2*640,
              radii=0.7,
              bondatoms=[(0,2), (0,3), (0,4), (1,5), (1,6), (1,7),],
              cameralocation=(0., 0., 6.),
             )
    pov.write('ethane-%02i.pov' % index)

traj = io.Trajectory('ethane.traj')

for index in range(len(traj)):
    makeimage(index)
This should result in a series of files: ethane-00.png, ethane-01.png, ..., being produced.
Stitch them together with ImageMagick
If you have the standard image-management toolbox ImageMagick, stitching these into an animated GIF is simple at the command line:
convert -delay 100 ethane-00.png ethane-00.png ethane-00.png ethane-01.png ethane-02.png ethane-03.png ethane-04.png ethane-05.png ethane-06.png ethane-07.png ethane-08.png ethane-09.png ethane-10.png -loop 0 animation.gif
I duplicated the first one three times, just to give a little pause before the animation restarts. This should give the animation below:

(Optional) Highlight some atoms
I often find it useful to highlight some atoms. In this example, I think it is interesting to see how the back H atoms reverse direction twice in this Cartesian representation. We can show that. Here is a script that puts it all together, including highlighting those atoms.
import os
from ase import io
from pgroup.ase.io import POV


def highlight_atoms(pov, atomlist, radius_scale=1.5,
                           color='Yellow', transmit=0.7):
    """Adds a ghost sphere around the specified atom, by writing an extra
    line to the generated .pov file. atomlist contains index numbers,
    radius_scale is the amount to multiply the radius in kwargs['radii']
    by, color is the highlight color, and transmit is a value between 0 and
    1 indicating the transparency. pov is the pov object from the proup
    module.
    """
    atoms = pov._atoms
    for index in atomlist:
        pos = atoms[index].position.copy()
        radius = radius_scale * pov._radii[index]
        line = ('sphere{<%.2f,%.2f,%.2f>, %.2f texture{pigment{color '
                '%s transmit %.2f}}}' %
                (pos[0], pos[1], pos[2], radius, color, transmit))
        f = open(pov._filename, 'a')
        f.write(line)
        f.close()


def makeimage(index):
    atoms = traj[index]
    pov = POV(atoms,
              pixelwidth=2 * 640,
              radii=0.7,
              bondatoms=[(0,2), (0,3), (0,4), (1,5), (1,6), (1,7)],
              cameralocation=(0., 0., 6.),
             )

    filename = 'blue-ethane-%02i.png' % index
    pov.write(filename, run_povray=False)
    highlight_atoms(pov, atomlist=[5, 6, 7],
                    color='Blue')
    pov.raytrace()
    return filename


# Make individual images.
traj = io.Trajectory('ethane.traj')
filenames = []
for index in range(len(traj)):
    filenames.append(makeimage(index))

# Build and run the imagemagick command.
cmd = ' '.join(filenames)
cmd = filenames[0] + ' ' + cmd
cmd = filenames[0] + ' ' + cmd
cmd = 'convert -delay 100 %s -loop 0 blue-animation.gif' % cmd
print(cmd)
os.system(cmd)
Which results in the nice image below.
Another example showing the pathway of a concerted proton transfer from a water layer to a surface is shown below.
Dependencies
The software tools needed to make the above happen are pretty standard ones:
- ASE
- pgroup -- Our group's software repository -- we use a different POV module than ASE does.
- POV-Ray -- The classic, open-source ray-tracing program.
- ImageMagick -- The classic, open-source image manipulation program.