Add atomic images to a pyplot figure
by Andrew Peterson
It can be nice to add atomic images directly to a figure made in pyplot (i.e., matplotlib). This is pretty simple to do using the tools of ASE. Here we just show a very simple example of plotting a row of atoms with an adsorbate on top.
import numpy as np
from matplotlib import pyplot
from ase.lattice.surface import fcc111
from ase import Atom
from ase.data import covalent_radii as radii
from ase.data.colors import jmol_colors
from matplotlib.patches import Circle

fig, ax = pyplot.subplots()

# Make the atoms; rotate so they are viewable with no z coordinates.
atoms = fcc111('Pt', (3, 1, 1), vacuum=20, a=4.0)
atoms.append(Atom('N', atoms[1].position + (0., 0., 2.1)))
atoms.rotate('x', -np.pi/2., rotate_cell=True)

# Add the atoms to the plot as circles.
for atom in atoms:
    color = jmol_colors[atom.number]
    radius = radii[atom.number]
    circle = Circle((atom.x, atom.y), radius, facecolor=color,
                            edgecolor='k', linewidth=1)
    ax.add_patch(circle)

# Enforce the circles are round (equal x and y scales) and turn off
# tickmarks.
ax.axis('equal')
ax.set_xticks([])
ax.set_yticks([])
ax.axis('off')

fig.savefig('out.png')
Most of the script above should be pretty self-explanatory, provided you are already comfortable with matplotlib and ASE.
The atoms are added to the plot as Circle patches.
The trick is to pull the atomic radii and colors from ASE, which are done with the covalent_radii and jmol_colors imports, respectively.
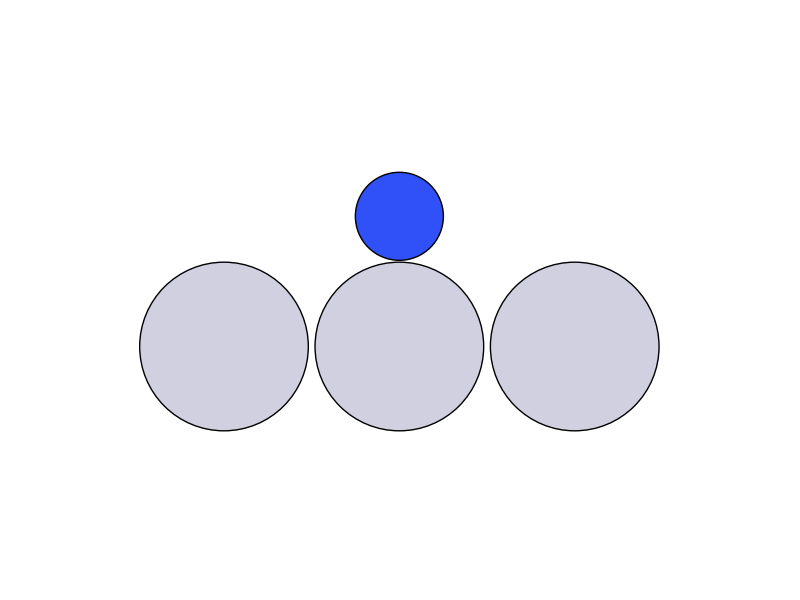
After this, the atoms show up just like they would in ASE gui, except on an axes canvas, so you can add any standard features from matplotlib on top of this figure.
The output of this simple script is shown below.