PROVIDENCE, R.I. [Brown University] — Last week at Brown, those who walk the beat had a meeting of the minds with those who crunch the numbers.
A weeklong workshop at the Institute for Computational and Experimental Research in Mathematics brought leaders of the Providence Police Department together with 25 mathematicians from across the globe to explore methods of using data to better anticipate and manage criminal activity.
The workshop gave mathematics researchers hands-on experience in applying mathematic models and techniques to crime data. At the same time, by using actual data from the City of Providence, workshop organizers expected the event to supply insights that might be useful to the police department.
Each of the mathematicians had a chance to take a ride-along with a Providence police officer before splitting into working groups to start seeing what kinds of patterns they could tease out of the data.
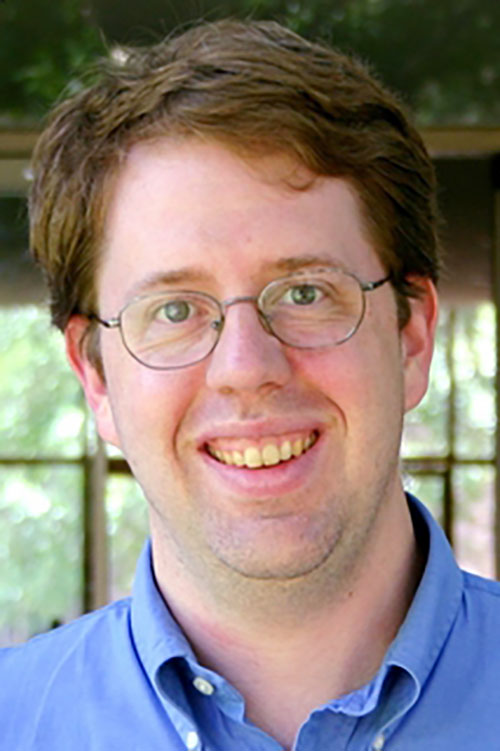
Brendan Hassett, professor of mathematics at Brown and director of ICERM, discussed the workshop and some of its outcomes in an interview.

How did this workshop come together?
The catalyst for this was a professor from UCLA, Andrea Bertozzi, who was also the founding chair of ICERM’s scientific advisory board. She’s well known for her work on mathematical models of crime. She created a center at UCLA that trains researchers to develop these kinds of models to analyze crime and arrest data, and they’ve created a product that’s used in around 30 police departments across the country.
Providence police chief Hugh Clements came to the workshop, as well as captains Dean Isabella and Michael Corriea. Dan Clement, crime and information systems specialist, and Ivan Monzon-Natareno, open data manager for the City of Providence, were there as well.
What kinds of datasets were used during the workshop?
The groups worked with several datasets provided by the City of Providence. One dataset dealt with police calls for service — the times and locations from which calls came, the squad cars that responded, how long it took to resolve the call and other information. Providence also provided some arrest data with information on where crimes took place, where people were arrested and the districts where those people live, among other things.
Another dataset used during the workshop centered on the city of Baltimore. We purchased from Twitter 2.2 million tweets originating from the Baltimore area around the time of the Freddie Gray protests last year. That dataset included words and hashtags in the tweets, as well as geographic information about where in the city the tweets came from.
What did participants do with those data?
There were some really interesting things that came from a group that analyzed the calls for service data. They analyzed the data using models that have been developed for other types of call centers, like customer service desks. They looked at the volume of calls from different areas as well as the distribution of how long it took to resolve calls — some may take 5 minutes and some may take several hours. From that they could do an analysis of how many police officers you’d ideally like to have in each district in order to clear the calls efficiently.
Another group used the arrest data to develop a network analysis of people who are arrested together. They started with one person, looked at all of the people that person was arrested with, then looked at all the people that those people were arrested with and so on. They found some really interesting statistical measures of how different groups in the city are connected. If you have someone that’s really highly connected to others in the network, maybe that person is a kingpin or they’re coordinating activities in some way. So it’s a way of seeing where police time could be used most effectively.
Another interesting outcome was from the Twitter data. That group used tweets to reconstruct how the rioting unfolded across the city of Baltimore around the time of the Freddie Gray incident. They ended up with some interesting models about how civil unrest moved through the city in real time. One of the models they used was one that’s used for infectious disease, which includes parameters that tell you how likely a disease is to be transmitted from one person to the people around them. They used these models on the Twitter data, and one of the things the found was that the rioting in Baltimore was five times as contagious as Ebola.
What happens next?
Each of the five working groups prepared presentations that they presented to the law enforcement participants. Some of those groups will probably go back and polish those presentations a bit more. The police leaders are interested in using these techniques to help interpret and visualize police data more clearly. I’ve told the math groups and the police that ICERM would support small collaborative groups on an ongoing basis and invited them all to come back.
Editor's note: This story has been updated to correct details about the origins of the workshop.