PROVIDENCE, R.I. [Brown University] — Modern data visualization software makes it easy for users to explore large datasets in search of interesting correlations and new discoveries. But that ease of use — the ability to ask question after question of a dataset with just a few mouse clicks — comes with a serious pitfall: it increases the likelihood of making false discoveries.
At issue is what statisticians refer to as “multiple hypothesis error.” The problem is essentially this: the more questions someone asks of a dataset, they more likely one is to stumble upon something that looks like a real discovery but is actually just a random fluctuation in the dataset.
A team of researchers from Brown University is working on software to help combat that problem. This week at the SIGMOD2017 conference in Chicago, they presented a new system called QUDE, which adds real-time statistical safeguards to interactive data exploration systems to help reduce false discoveries.
“More and more people are using data exploration software like Tableau and Spark, but most of those users aren’t experts in statistics or machine learning,” said Tim Kraska, an assistant professor of computer science at Brown and a co-author of the research. “There are a lot of statistical mistakes you can make, so we’re developing techniques that help people avoid them.”
Multiple hypothesis testing error is a well-known issue in statistics. In the era of big data and interactive data exploration, the issue has come to a renewed prominence Kraska says.
“These tools make it so easy to query data,” he said. “You can easily test 100 hypotheses in an hour using these visualization tools. Without correcting for multiple hypothesis error, the chances are very good that you’re going to come across a correlation that’s completely bogus.”
There are well-known statistical techniques for dealing with the problem. Most of those techniques involve adjusting the level of statistical significance required to validate a particular hypothesis based on how many hypotheses have been tested in total. As the number of hypothesis tests increases, the significance level needed to judge a finding as valid increases as well.
But these correction techniques are nearly all after-the-fact adjustments. They’re tools that are used at the end of a research project after all the hypothesis testing is complete, which is not ideal for real-time, interactive data exploration.
“We don’t want to wait until the end of a session to tell people if their results are valid,” said Eli Upfal, a computer science professor at Brown and research co-author. “We also don’t want to have the system reverse itself by telling you at one point in a session that something is significant only to tell you later — after you’ve tested more hypotheses — that your early result isn’t significant anymore.”
Both of those scenarios are possible using the most common multiple hypothesis correction methods. So the researchers developed a different method for this project that enables them to monitor the risk of false discovery as hypothesis tests are ongoing.
“The idea is that you have a budget of how much false discovery risk you can take, and we update that budget in real time as a user interacts with the data,” Upfal said. “We also take into account the ways in which user might explore the data. By understanding the sequence of their questions, we can adapt our algorithm and change the way we allocate the budget.”
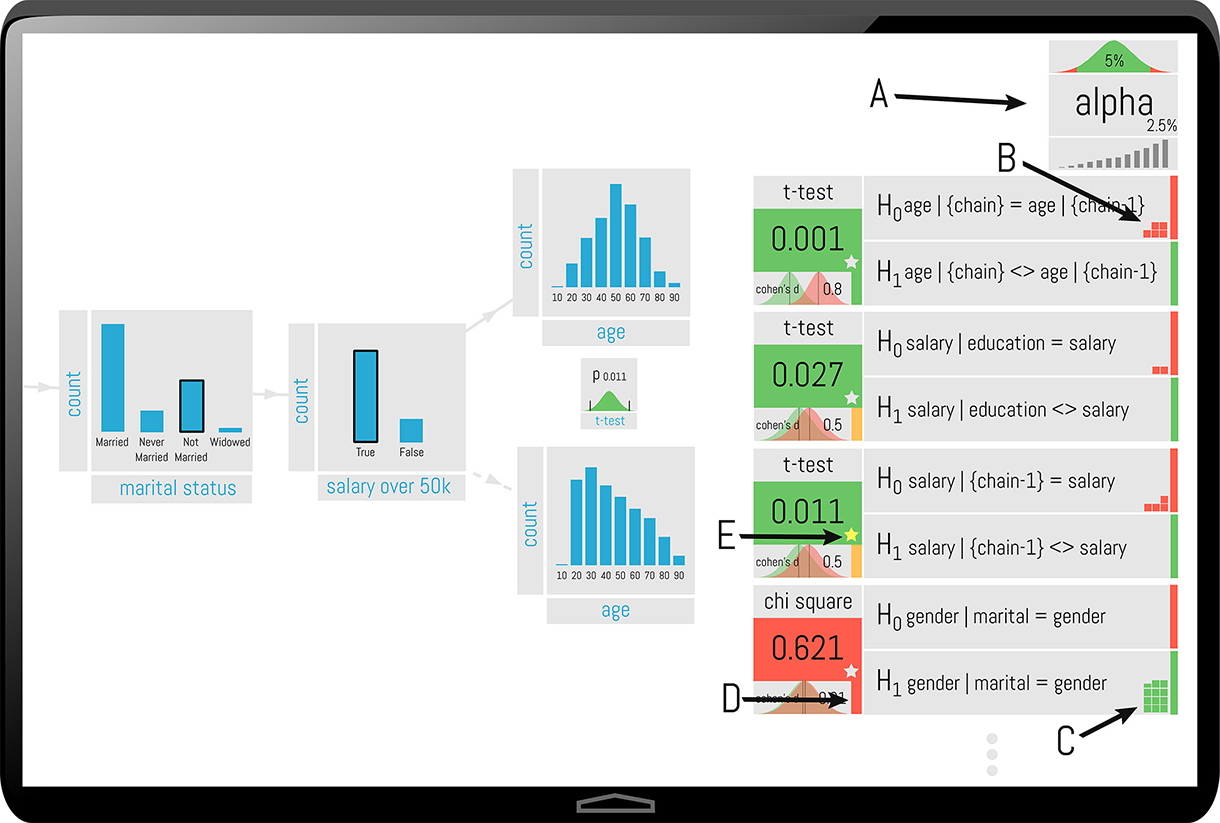
For users, the experience is similar to using any data visualization software, only with color-coded feedback that gives information about statistical significance.
“Green means that a visualization represents a finding that’s significant,” Kraska said. “If it’s red, that means to be careful; this is on shaky statistical ground.”
The system can’t guarantee absolute accuracy, the researchers say. No system can. But in a series of user tests using synthetic data for which the real and bogus correlations had been ground-truthed, the researchers showed that the system did indeed reduce the number of false discoveries users made.
The researchers consider this work a step toward a data exploration and visualization system that fully integrates a suite of statistical safeguards.
“Our goal is to make data science more accessible to a broader range of users,” Kraska said. “Tackling the multiple hypothesis problem is going to be important, but it’s also very difficult to do. We see this paper as a good first step.”